
Concept explainers
Videos
(a)
To draw: a
(a)
Answer to Problem 88RE
From the scatter plot, the relation that exists between two variables appears tobe cubic.
Explanation of Solution
Given:
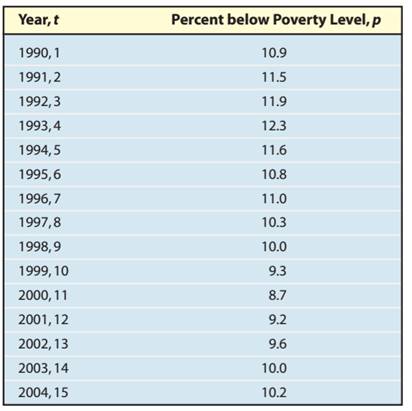
Calculation:
The scatter diagram as follow:

From the scatter plot we can see that the relation that exists between two variables appears tobe cubic.
Conclusion:
Thus, the scatter diagram is drawn.
(b)
To predict: the percentage of U.S. families that were below the poverty level
(b)
Answer to Problem 88RE
The percentage of U.S. families that were below poverty line is 11.472%.
Explanation of Solution
Calculation:
From the graph, cubic function is the best fit to these data because cubic
Curve is passing from most of the points and it is capturing the change in the data better than the other functions.
The cubic function is,
In 2005, the percentage of U.S. families that were below poverty line can be calculated bysubstituting
Conclusion:
The percentage of U.S. families that were below poverty line is 11.472%
(c)
To draw: the function of best fit on the scatter diagram drawn in part (a).
(c)
Answer to Problem 88RE
Explanation of Solution
Calculation:
The graph of cubic function is as follows,

Conclusion:
Thus, the required graph is drawn.
Chapter 4 Solutions
Precalculus
Additional Math Textbook Solutions
Elementary Statistics (13th Edition)
Thinking Mathematically (6th Edition)
Elementary Statistics
A First Course in Probability (10th Edition)
Calculus: Early Transcendentals (2nd Edition)
University Calculus: Early Transcendentals (4th Edition)


- 3:59 m s ☑ D'Aniello Boutique | Fashion VOLTE danielloboutique.it/asia SUBSCRIBE NOW: 10% OFF TO USE ANYTIME YOU WANT d'aniello NEW IN WOMEN NEW IN MEN WINTER SALE: 50% OFF on FW24 SHOP WOMEN SHOP MENarrow_forwardJOB UPDATE EMERSON GRAD ENGINEER (FRESHERS) SOFTWARE ENGG NEW RELIC BROWSERSTACK (FRESHERS) SOFTWARE ENGG FULL STACK DATA ENGINEER GENPACT + PYTHON CARS24 WORK FROM HOME #vinkjobs TELE PERFORMANCE Vinkjobs.com CUSTOMER SUPPORT Search "Vinkjobs.com" on Googlearrow_forwarddo question 2 pleasearrow_forward
- question 10 pleasearrow_forward00 (a) Starting with the geometric series Σ X^, find the sum of the series n = 0 00 Σηχη - 1, |x| < 1. n = 1 (b) Find the sum of each of the following series. 00 Σnx", n = 1 |x| < 1 (ii) n = 1 sin (c) Find the sum of each of the following series. (i) 00 Σn(n-1)x^, |x| <1 n = 2 (ii) 00 n = 2 n² - n 4n (iii) M8 n = 1 շոarrow_forward(a) Use differentiation to find a power series representation for 1 f(x) = (4 + x)²* f(x) = 00 Σ n = 0 What is the radius of convergence, R? R = (b) Use part (a) to find a power series for f(x) = 1 (4 + x)³° f(x) = 00 Σ n = 0 What is the radius of convergence, R? R = (c) Use part (b) to find a power series for f(x) = x² (4 + x)³* 00 f(x) = Σ n = 2 What is the radius of convergence, R? R = Need Help? Read It Watch It SUBMIT ANSWERarrow_forward
- answer for question 4 pleasearrow_forward(3) (20 points) Let F(x, y, z) = (y, z, x²z). Define E = {(x, y, z) | x² + y² ≤ z ≤ 1, x ≤ 0}. (a) (2 points) Calculate the divergence V. F. (b) (4 points) Let D = {(x, y) | x² + y² ≤ 1, x ≤ 0} Without calculation, show that the triple integral √ (V · F) dV = √ 2²(1. = x²(1 − x² - y²) dA. Earrow_forward(2) (22 points) Let F(x, y, z) = (x sin y, cos y, ―xy). (a) (2 points) Calculate V. F. (b) (6 points) Given a vector field is everywhere defined with V G₁(x, y, z) = * G2(x, y, z) = − G3(x, y, z) = 0. 0 0 F(x, y, z) = (F₁(x, y, z), F₂(x, y, z), F(x, y, z)) that F = 0, let G = (G1, G2, G3) where F₂(x, y, y, t) dt - √ F³(x, t, 0) dt, * F1(x, y, t) dt, t) dt - √ F Calculate G for the vector field F(x, y, z) = (x sin y, cos y, -xy).arrow_forward
- Evaluate the following integral over the Region R. (Answer accurate to 2 decimal places). √ √(x + y) A R R = {(x, y) | 25 < x² + y² ≤ 36, x < 0} Hint: The integral and Region is defined in rectangular coordinates.arrow_forwardFind the volume of the solid that lies under the paraboloid z = 81 - x² - y² and within the cylinder (x − 1)² + y² = 1. A plot of an example of a similar solid is shown below. (Answer accurate to 2 decimal places). Volume using Double Integral Paraboloid & Cylinder -3 Hint: The integral and region is defined in polar coordinates.arrow_forwardEvaluate the following integral over the Region R. (Answer accurate to 2 decimal places). √4(1–2² 4(1 - x² - y²) dA R 3 R = {(r,0) | 0 ≤ r≤ 2,0π ≤0≤¼˜}. Hint: The integral is defined in rectangular coordinates. The Region is defined in polar coordinates.arrow_forward
 Calculus: Early TranscendentalsCalculusISBN:9781285741550Author:James StewartPublisher:Cengage Learning
 Thomas' Calculus (14th Edition)CalculusISBN:9780134438986Author:Joel R. Hass, Christopher E. Heil, Maurice D. WeirPublisher:PEARSON
 Calculus: Early Transcendentals (3rd Edition)CalculusISBN:9780134763644Author:William L. Briggs, Lyle Cochran, Bernard Gillett, Eric SchulzPublisher:PEARSON
 Calculus: Early TranscendentalsCalculusISBN:9781319050740Author:Jon Rogawski, Colin Adams, Robert FranzosaPublisher:W. H. Freeman
 Calculus: Early Transcendental FunctionsCalculusISBN:9781337552516Author:Ron Larson, Bruce H. EdwardsPublisher:Cengage Learning