
Concept explainers
Videos
Mixed Practice In Problems
To graph: The polynomial function
Explanation of Solution
Given Information:
The polynomial function
Graph:
The steps of graph of the polynomial function as follows:
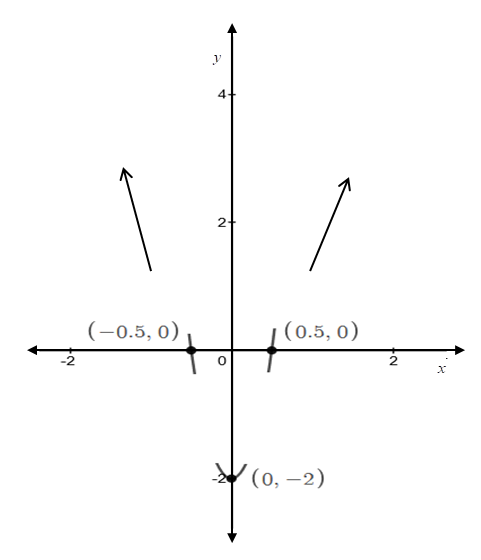
Step 1: First, find the end behavior of the graph of the function
Here, the degree of the polynomial function
The graph of the function
Step 2: Find
For the
Thus, the
For the
Since there is 1 variation in the sign of the non-zero coefficients of
There is 1 variation in the sign of the non-zero coefficients of
By using the Rational Zero Theorem, all possible rational zeroes are of the form
In the polynomial
Factors of the constant term
Factors of the leading term
Therefore, all possible rational zeros are:
Simplifies to,
As there are
Now, test
Here, since the remainder is 0,
To write the factors of
Here,
Any solution to this depressed equation is also a zero of
The depressed equation
Thus, the real zeros of the polynomial function
Step 3: The maximum number of turning points on the graph of the function
The polynomial function
Step 4: Now, use the information obtained in step 1 to 3 to draw the graph of the function
Now, find additional points on the graph.
For
For
Now, plot all these coordinates
So, the graph of the function is obtained as follows:
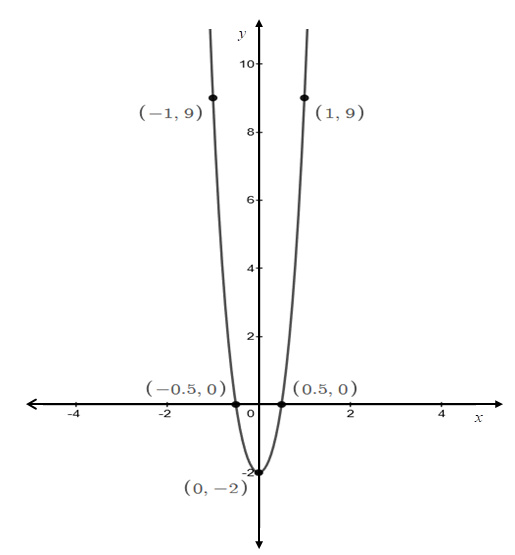
Interpretation:
The graph represents the polynomial function
Chapter 4 Solutions
Precalculus
Additional Math Textbook Solutions
Pre-Algebra Student Edition
Basic Business Statistics, Student Value Edition
A First Course in Probability (10th Edition)
A Problem Solving Approach To Mathematics For Elementary School Teachers (13th Edition)
University Calculus: Early Transcendentals (4th Edition)


- Let the region R be the area enclosed by the function f(x)= = 3x² and g(x) = 4x. If the region R is the base of a solid such that each cross section perpendicular to the x-axis is an isosceles right triangle with a leg in the region R, find the volume of the solid. You may use a calculator and round to the nearest thousandth. y 11 10 9 00 8 7 9 5 4 3 2 1 -1 -1 x 1 2arrow_forwardLet the region R be the area enclosed by the function f(x) = ex — 1, the horizontal line y = -4 and the vertical lines x = 0 and x = 3. Find the volume of the solid generated when the region R is revolved about the line y = -4. You may use a calculator and round to the nearest thousandth. 20 15 10 5 y I I I | I + -1.5 -1 -0.5 0.5 1 1.5 2 2.5 3 -5 I -10 -15 I + I I T I I + -20 I + -25 I I I -30 I 3.5 4 xarrow_forwardplease show all the workarrow_forward
 Calculus: Early TranscendentalsCalculusISBN:9781285741550Author:James StewartPublisher:Cengage Learning
 Thomas' Calculus (14th Edition)CalculusISBN:9780134438986Author:Joel R. Hass, Christopher E. Heil, Maurice D. WeirPublisher:PEARSON
 Calculus: Early Transcendentals (3rd Edition)CalculusISBN:9780134763644Author:William L. Briggs, Lyle Cochran, Bernard Gillett, Eric SchulzPublisher:PEARSON
 Calculus: Early TranscendentalsCalculusISBN:9781319050740Author:Jon Rogawski, Colin Adams, Robert FranzosaPublisher:W. H. Freeman
 Calculus: Early Transcendental FunctionsCalculusISBN:9781337552516Author:Ron Larson, Bruce H. EdwardsPublisher:Cengage Learning