
Concept explainers
Videos
(a)
To draw: a
(a)
Answer to Problem 109AYU
Explanation of Solution
Given:
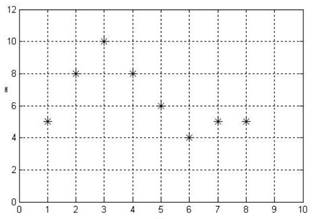
| Decade, x | Major Hurricanes Striking United States, H |
| 1921-1930, 1 | 5 |
| 1931-1940, 2 | 8 |
| 1941-1950, 3 | 10 |
| 1951-1960, 4 | 8 |
| 1961-1970, 5 | 6 |
| 1971-1980, 6 | 4 |
| 1981-1990, 7 | 5 |
| 1991-2000, 8 | 5 |
Calculation:
Figure 1 shows the scatter diagram. A cubic relation may exist between the two variables x and H.
Figure 1

Conclusion:
Therefore, the scatter diagram is drawn.
(b)
To find: the cubic function of best fit
(b)
Answer to Problem 109AYU
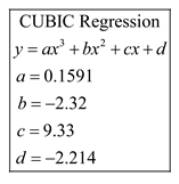
The cubic equation of best fit to the data is
Explanation of Solution
Calculation:
Upon executing the CUBIC Regression Program, obtained results are shown in Figure 2. The output that the utility provides shows us the equation
The cubic equation of best fit to the data is
Figure 2
Conclusion:
The cubic equation of best fit to the data is
(c)
To predict: the number of major hurricanes that struck the United States
(c)
Answer to Problem 109AYU
The no. of major hurricane is 6.
Explanation of Solution
Calculation:
The cubic equation of best fit to the data is
In Figure 1, point
The no. of major hurricane that struck the United States between 1961 through 1970 can be calculated as
The no. of major hurricane is 6.
Conclusion:
The no. of major hurricane is 6.
(d)
To draw: a graph of the cubic function of best fit
(d)
Answer to Problem 109AYU

Explanation of Solution
Calculation:
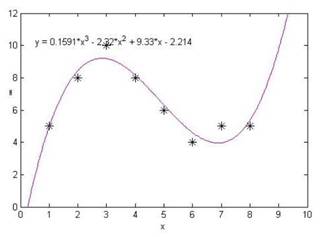
Figure 3 shows the graph of the cubic function of best fit on the scatter diagram. The function fits the data reasonably well. The cubic function of best fit passes through all the point very nearly.
Figure 3
Conclusion:
Therefore, the required graph is drawn.
(e)
To predict: the number of major hurricanes and explain whether the result appear to agree with what the scientists believe.
(e)
Answer to Problem 109AYU
The no. of major hurricane is 10.
The result appears to agree with what these scientists believe.
Explanation of Solution
Calculation:
In Figure 1 point
The no. of major hurricane that struck the United States between 2001 and 2009 can be calculated as
Therefore the no. of major hurricane that struck the United States between 2001 through 2009 is equal to 10.
From Figure 3 at the point
So, the result appears to agree with what these scientists believe.
Conclusion:
Therefore the no. of major hurricane is 10 and the result appears to agree with what these scientists believe.
(f)
To find: whether the given statement support or contradict the prediction
(f)
Answer to Problem 109AYU
The prediction supports our result in part €
Explanation of Solution
Given:
From 2001 through 2010,10 major hurricanes struck the United States.
From 2001 through 2009, 10 major hurricanes struck the United States.
Our prediction in part (e) shows that the no. of major hurricane in United States is equal to 10.
The answer is yes, this prediction supports our result in part (e).
Conclusion:
Therefore, theprediction supports our result in part €
Chapter 4 Solutions
Precalculus
Additional Math Textbook Solutions
Calculus: Early Transcendentals (2nd Edition)
Thinking Mathematically (6th Edition)
Elementary Statistics: Picturing the World (7th Edition)
A First Course in Probability (10th Edition)
Algebra and Trigonometry (6th Edition)


- 7) 8) Let R be the region bounded by the given curves as shown in the figure. If the line x = k divides R into two regions of equal area, find the value of k 7. y = 3√x, y = √x and x = 4 8. y = -2, y = 3, x = −3, and x = −1 -1 2 +1 R Rarrow_forwardSolve this question and show steps.arrow_forwardu, v and w are three coplanar vectors: ⚫ w has a magnitude of 10 and points along the positive x-axis ⚫ v has a magnitude of 3 and makes an angle of 58 degrees to the positive x- axis ⚫ u has a magnitude of 5 and makes an angle of 119 degrees to the positive x- axis ⚫ vector v is located in between u and w a) Draw a diagram of the three vectors placed tail-to-tail at the origin of an x-y plane. b) If possible, find w × (ū+v) Support your answer mathematically or a with a written explanation. c) If possible, find v. (ū⋅w) Support your answer mathematically or a with a written explanation. d) If possible, find u. (vxw) Support your answer mathematically or a with a written explanation. Note: in this question you can work with the vectors in geometric form or convert them to algebraic vectors.arrow_forward
- Question 3 (6 points) u, v and w are three coplanar vectors: ⚫ w has a magnitude of 10 and points along the positive x-axis ⚫ v has a magnitude of 3 and makes an angle of 58 degrees to the positive x- axis ⚫ u has a magnitude of 5 and makes an angle of 119 degrees to the positive x- axis ⚫ vector v is located in between u and w a) Draw a diagram of the three vectors placed tail-to-tail at the origin of an x-y plane. b) If possible, find w × (u + v) Support your answer mathematically or a with a written explanation. c) If possible, find v. (ū⋅ w) Support your answer mathematically or a with a written explanation. d) If possible, find u (v × w) Support your answer mathematically or a with a written explanation. Note: in this question you can work with the vectors in geometric form or convert them to algebraic vectors.arrow_forwardK Find all values x = a where the function is discontinuous. For each value of x, give the limit of the function as x approaches a. Be sure to note when the limit doesn't exist. x-7 p(x) = X-7 Select the correct choice below and, if necessary, fill in the answer box(es) within your choice. (Use a comma to separate answers as needed.) OA. f is discontinuous at the single value x = OB. f is discontinuous at the single value x= OC. f is discontinuous at the two values x = OD. f is discontinuous at the two values x = The limit is The limit does not exist and is not co or - ∞. The limit for the smaller value is The limit for the larger value is The limit for the smaller value is The limit for the larger value does not exist and is not c∞ or -arrow_forwardK x3 +216 complete the table and use the results to find lim k(x). If k(x) = X+6 X-6 X -6.1 -6.01 - 6.001 - 5.999 - 5.99 -5.9 k(x) Complete the table. X -6.1 -6.01 - 6.001 - 5.999 - 5.99 - 5.9 k(x) (Round to three decimal places as needed.) Find the limit. Select the correct choice below and, if necessary, fill in the answer box within your choice.arrow_forward
- For each of the following series, determine whether the absolute convergence series test determines absolute convergence or fails. For the ¿th series, if the test is inconclusive then let Mi = 4, while if the test determines absolute convergence let Mi 1 : 2: ∞ Σ(−1)"+¹ sin(2n); n=1 Σ n=1 Σ ((−1)”. COS n² 3+2n4 3: (+ 4: 5 : n=1 ∞ n 2+5n3 ПП n² 2 5+2n3 пп n² Σ(+)+ n=1 ∞ n=1 COS 4 2 3+8n3 П ηπ n- (−1)+1 sin (+727) 5 + 2m³ 4 = 8. Then the value of cos(M₁) + cos(2M2) + cos(3M3) + sin(2M) + sin(M5) is -0.027 -0.621 -1.794 -1.132 -1.498 -4.355 -2.000 2.716arrow_forwardi need help with this question i tried by myself and so i am uploadding the question to be quided with step by step solution and please do not use chat gpt i am trying to learn thank you.arrow_forwardi need help with this question i tried by myself and so i am uploadding the question to be quided with step by step solution and please do not use chat gpt i am trying to learn thank you.arrow_forward
 Calculus: Early TranscendentalsCalculusISBN:9781285741550Author:James StewartPublisher:Cengage Learning
 Thomas' Calculus (14th Edition)CalculusISBN:9780134438986Author:Joel R. Hass, Christopher E. Heil, Maurice D. WeirPublisher:PEARSON
 Calculus: Early Transcendentals (3rd Edition)CalculusISBN:9780134763644Author:William L. Briggs, Lyle Cochran, Bernard Gillett, Eric SchulzPublisher:PEARSON
 Calculus: Early TranscendentalsCalculusISBN:9781319050740Author:Jon Rogawski, Colin Adams, Robert FranzosaPublisher:W. H. Freeman
 Calculus: Early Transcendental FunctionsCalculusISBN:9781337552516Author:Ron Larson, Bruce H. EdwardsPublisher:Cengage Learning