
Interpretation:
The structure of starch and cellulose should be compared and contrast. The reasons due to which structural differences affect our ability to digest both should be determined.
Concept introduction:
A biological molecule which consists of carbon, hydrogen and oxygen is known as saccharide or carbohydrate. The general formula of saccharide is
Saccharides (sugar) are classified as: monosaccharides, disaccharides and polysaccharides.
Monosaccharides are defined as a simpler carbohydrate which contains one sugar molecule and can’t be hydrolysed into smaller carbohydrate.
Disaccharides are defined as a saccharide which contains two sugar molecules that is when two monosaccharides are linked by glycosidic bonds. It is a double ring structure.
Polysaccharides are defined as a saccharide which contains many units of sugar molecules that is more than two monosaccharides are linked by glycosidic bonds.
Explanation of Solution
Starch consists of many units of monosaccharide as it is a
Cellulose consists of many units of monosaccharide or sugar as it is a polymeric carbohydrate which consists of various sugar units linked with glycosidic bonds.
The structures of both cellulose and starch are similar as both contains similar ring structures consist of carbon atoms, hydrogen atoms and oxygen atoms. Both starch and cellulose consist of ether bond.
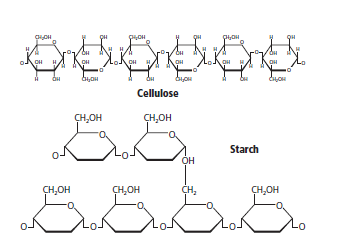
According to the above structures, cellulose is an unbranched structure or a linear molecule whereas the starch is not a linear molecule or branched structure.
Now, the linear structure of cellulose results in the strong and rigid structure as linear structure allows the chain (molecule) to stick with each other whereas the starch consist of glucose units which makes them insoluble in water results in the storage reservoir for energy.
Thus, cellulose is insoluble
One can eat starch but one can’t able to digest cellulose. Our body consist of enzymes which has ability to break down the starch molecule into glucose units.
Chapter 23 Solutions
Chemistry: Matter and Change
Additional Science Textbook Solutions
Campbell Biology: Concepts & Connections (9th Edition)
Chemistry: Structure and Properties (2nd Edition)
Applications and Investigations in Earth Science (9th Edition)
Human Anatomy & Physiology (2nd Edition)
Campbell Essential Biology (7th Edition)
Campbell Biology (11th Edition)

- In the following reaction, what quantity in moles of CH₃OH are required to give off 4111 kJ of heat? 2 CH₃OH (l) + 3 O₂ (g) → 2 CO₂ (g) + 4 H₂O(g) ∆H° = -1280. kJarrow_forwardIndicate the processes in the dismutation of Cu2O.arrow_forward1. Consider these three reactions as the elementary steps in the mechanism for a chemical reaction. 2600 2400 2200 2000 1800 1600 1400 1200 1000 800 Potential Energy (kJ) 600 400 200 0 -200- -400 -600- -800 (i) Cl₂ (g) + Pt(s) → 2Cl (g) + Pt(s) (ii) Cl (g)+ CO (g) + Pt (s) → CICO (g) + Pt (s) Ea = 1550 kJ Ea = 2240 kJ (iii) Cl (g) + CICO (g) → Cl₂CO (g) Ea = 2350 kJ AH=-950 kJ ΔΗ = 575 ΚΙ AH=-825 kJ a. Draw the potential energy diagram for the reaction. Label the data points for clarity. The potential energy of the reactants is 600 kJ Reaction Progress b. What is the overall chemical equation? c. What is the overall change in enthalpy for the above chemical reaction? d. What is the overall amount of activation energy for the above chemical reaction? e. Which reaction intermediate would be considered a catalyst (if any) and why? f. If you were to add 2700kJ of energy to the reaction (e.g. 2700 kl of heat or electricity), would you be able to make the reaction reverse itself (i.e. have…arrow_forward
- draw the enolate anion and the carbonyl that would be needed to make this product through an aldol addition reaction.arrow_forwardDraw the Michael Adduct and the final product of the Robinson annulation reaction. Ignore inorganic byproducts.arrow_forwardDraw the Michael adduct and final product of the Robinson annulation reaction. Ignore inorganic byproductsarrow_forward
- Post Lab Questions. 1) Draw the mechanism of your Diels-Alder cycloaddition. 2) Only one isomer of product is formed in the Diels-Alder cycloaddition. Why? 3) Imagine that you used isoprene as diene - in that case you don't have to worry about assigning endo vs exo. Draw the "endo" and "exo" products of the Diels-Alder reaction between isoprene and maleic anhydride, and explain why the distinction is irrelevant here. 4) This does not hold for other dienes. Draw the exo and endo products of the reaction of cyclohexadiene with maleic anhydride. Make sure you label your answers properly as endo or exo. 100 °C Xylenes ??? 5) Calculate the process mass intensity for your specific reaction (make sure to use your actual amounts of reagent).arrow_forwardIndicate the product(s) A, B C and D that are formed in the reaction: H + NH-NH-CH [A+B] [C+D] hydrazonesarrow_forwardHow can you prepare a 6 mL solution of 6% H2O2, if we have a bottle of 30% H2O2?arrow_forward
- How many mL of H2O2 from the 30% bottle must be collected to prepare 6 mL of 6% H2O2.arrow_forwardIndicate the product(s) B and C that are formed in the reaction: HN' OCH HC1 B + mayoritario C minoritario OCH3arrow_forwardIndicate the product(s) that are formed in the reaction: NH-NH, OCH3 -H₂O OCH3arrow_forward
 ChemistryChemistryISBN:9781305957404Author:Steven S. Zumdahl, Susan A. Zumdahl, Donald J. DeCostePublisher:Cengage Learning
 ChemistryChemistryISBN:9781259911156Author:Raymond Chang Dr., Jason Overby ProfessorPublisher:McGraw-Hill Education
 Principles of Instrumental AnalysisChemistryISBN:9781305577213Author:Douglas A. Skoog, F. James Holler, Stanley R. CrouchPublisher:Cengage Learning
 Organic ChemistryChemistryISBN:9780078021558Author:Janice Gorzynski Smith Dr.Publisher:McGraw-Hill Education
 Chemistry: Principles and ReactionsChemistryISBN:9781305079373Author:William L. Masterton, Cecile N. HurleyPublisher:Cengage Learning
 Elementary Principles of Chemical Processes, Bind...ChemistryISBN:9781118431221Author:Richard M. Felder, Ronald W. Rousseau, Lisa G. BullardPublisher:WILEY