
(a)
Interpretation:
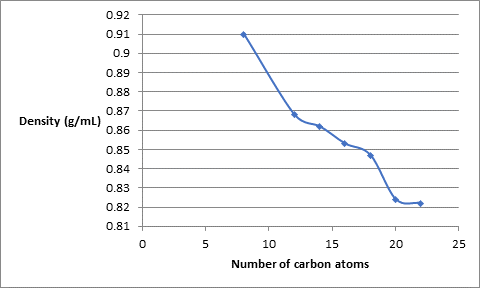
A graph needs to be plotted for the number of carbon atoms versus the melting point.
Concept introduction:
To plot a graph using data with two variables, one of the variables is taken on the x-axis and the other on the y-axis. The pattern followed by two variables with respect to each other can be interpreted from the graph.
Explanation of Solution
The given data is as follows:

The plot can be represented as follows:

(b)
Interpretation:
The graph between numbers of carbon atoms versus density needs to be determined.
Concept introduction:
To plot a graph using data with two variables, one of the variables is taken on the x-axis and the other on the y-axis. The pattern followed by two variables with respect to each other can be interpreted from the graph.
Explanation of Solution
The data given is as follows:
The plot can be represented as follows:
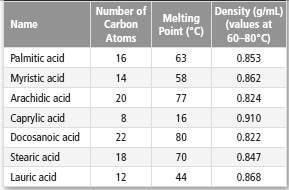
(c)
Interpretation:
From the plot, the relationship between number of C atoms and its density and melting point values needs to be explained.
Concept introduction:
To plot a graph using data with two variables, one of the variables is taken on the x-axis and the other on the y-axis. The pattern followed by two variables with respect to each other can be interpreted from the graph.
Explanation of Solution
From the plot, it can be seen that the melting point increases with the number of carbon atoms in the saturated fatty acids. But, as the number of carbon atoms increases, the density of the saturated fatty acids decreases.
(d)
Interpretation:
The appropriate melting point of saturated fatty acid with 24 carbon atoms needs to be determined.
Concept introduction:
To plot a graph using data with two variables, one of the variables is taken on the x-axis and the other on the y-axis. The pattern followed by two variables with respect to each other can be interpreted from the graph.
Explanation of Solution
The approximate value can be obtained from the graph formed between the number of carbon atoms and the melting point.
The plot is represented as follows:
If the number of carbon atoms in a fatty acid is 24, the corresponding value of the melting point can be easily determined from the graph. The value will be approximately 82-83 oC.
Chapter 23 Solutions
Chemistry: Matter and Change
Additional Science Textbook Solutions
Chemistry: The Central Science (14th Edition)
Introductory Chemistry (6th Edition)
Chemistry: An Introduction to General, Organic, and Biological Chemistry (13th Edition)
Genetic Analysis: An Integrated Approach (3rd Edition)
College Physics: A Strategic Approach (3rd Edition)
Human Anatomy & Physiology (2nd Edition)

- NMR spectrum of ethyl acetate has signals whose chemical shifts are indicated below. Which hydrogen or set of hydrogens corresponds to the signal at 4.1 ppm? Select the single best answer. The H O HỌC—C—0—CH, CH, 2 A ethyl acetate H NMR: 1.3 ppm, 2.0 ppm, 4.1 ppm Check OA B OC ch B C Save For Later Submit Ass © 2025 McGraw Hill LLC. All Rights Reserved. Terms of Use | Privacy Center |arrow_forwardHow many signals do you expect in the H NMR spectrum for this molecule? Br Br Write the answer below. Also, in each of the drawing areas below is a copy of the molecule, with Hs shown. In each copy, one of the H atoms is colored red. Highlight in red all other H atoms that would contribute to the same signal as the H already highlighted red Note for advanced students: In this question, any multiplet is counted as one signal. 1 Number of signals in the 'H NMR spectrum. For the molecule in the top drawing area, highlight in red any other H atoms that will contribute to the same signal as the H atom already highlighted red. If no other H atoms will contribute, check the box at right. Check For the molecule in the bottom drawing area, highlight in red any other H atoms that will contribute to the same signal as the H atom already highlighted red. If no other H atoms will contribute, check the box at right. O ✓ No additional Hs to color in top molecule ง No additional Hs to color in bottom…arrow_forwardin the kinetics experiment, what were the values calculated? Select all that apply.a) equilibrium constantb) pHc) order of reactiond) rate contstantarrow_forward
- true or false, given that a 20.00 mL sample of NaOH took 24.15 mL of 0.141 M HCI to reach the endpoint in a titration, the concentration of the NaOH is 1.17 M.arrow_forwardin the bromothymol blue experiment, pKa was measured. A closely related compound has a Ka of 2.10 x 10⁻⁵. What is the pKa?a) 7.1b) 4.7c) 2.0arrow_forwardcalculate the equilibrium concentration of H2 given that K= 0.017 at a constant temperature for this reaction. The inital concentration of HBr is 0.050 M.2HBr(g) ↔ H2(g) + Br2(g)a) 4.48 x 10⁻² M b) 5.17 x 10⁻³ Mc) 1.03 x 10⁻² Md) 1.70 x 10⁻² Marrow_forward
- true or falsegiven these two equilibria with their equilibrium constants:H2(g) + CI2(l) ↔ 2HCI(g) K= 0.006 CI2(l) ↔ CI2(g) K= 0.30The equilibrium contstant for the following reaction is 1.8H2(g) + CI2 ↔ 2HCI(g)arrow_forwardI2(g) + CI2(g) ↔ 2ICIK for this reaction is 81.9. Find the equilibrium concentration of I2 if the inital concentration of I2 and CI2 are 0.010 Marrow_forwardtrue or false,the equilibrium constant for this reaction is 0.50.PCI5(g) ↔ PCI3(g) + CI2(g)Based on the above, the equilibrium constant for the following reaction is 0.25.2PCI5(g) ↔. 2PCI3(g) + 2CI2(g)arrow_forward
- true or false, using the following equilibrium, if carbon dioxide is added the equilibrium will shift toward the productsC(s) + CO2(g) ↔ 2CO(g)arrow_forward2S2O2/3- (aq) + I2 (aq) ---> S4O2/6- (aq) +2I- (aq) Experiment I2 (M) S2O3- (M) Initital Rate (M/s) 1 0.01 0.01 0.0004 2 0.01 0.02 0.0004 3 0.02 0.01 0.0008 Calculate the overall order for this reaction using the table data a) 3b) 0c) 2d) 1arrow_forwardthe decomposition of N2O5 is the first order with a half-life of 1.98 minutes. If the inital concentration of N2O5 is 0.200 M, what is the concentration after 6 minutes?a) 0.612 Mb) 0.035 Mc) 0.024 Md) 0.100 Marrow_forward
 ChemistryChemistryISBN:9781305957404Author:Steven S. Zumdahl, Susan A. Zumdahl, Donald J. DeCostePublisher:Cengage Learning
 ChemistryChemistryISBN:9781259911156Author:Raymond Chang Dr., Jason Overby ProfessorPublisher:McGraw-Hill Education
 Principles of Instrumental AnalysisChemistryISBN:9781305577213Author:Douglas A. Skoog, F. James Holler, Stanley R. CrouchPublisher:Cengage Learning
 Organic ChemistryChemistryISBN:9780078021558Author:Janice Gorzynski Smith Dr.Publisher:McGraw-Hill Education
 Chemistry: Principles and ReactionsChemistryISBN:9781305079373Author:William L. Masterton, Cecile N. HurleyPublisher:Cengage Learning
 Elementary Principles of Chemical Processes, Bind...ChemistryISBN:9781118431221Author:Richard M. Felder, Ronald W. Rousseau, Lisa G. BullardPublisher:WILEY