Concept explainers
Interpretation:
The difficulty of drawing a bar graph of each ion’s concentration is to be identified.
Concept introduction:
The bar graph is graphical display of data using bars of different lengths.
Explanation of Solution
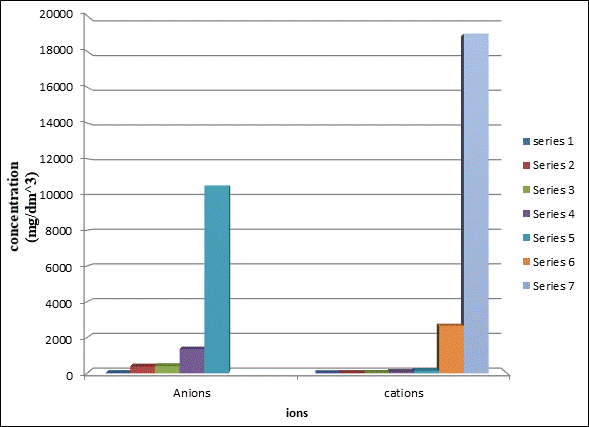
The bar graph between the metal ions and its concentration is represented as follows:

The bar graph of ion’s concentration is difficult to draw because there are very large differences that are observed between their results.
As per the data, some results are very small and some results are very large.
Chapter 7 Solutions
Chemistry: Matter and Change
Additional Science Textbook Solutions
Campbell Biology: Concepts & Connections (9th Edition)
Laboratory Experiments in Microbiology (12th Edition) (What's New in Microbiology)
Campbell Biology in Focus (2nd Edition)
Microbiology: An Introduction
The Cosmic Perspective (8th Edition)
Introductory Chemistry (6th Edition)
- 1. Calculate the accurate monoisotopic mass (using all 1H, 12C, 14N, 160 and 35CI) for your product using the table in your lab manual. Don't include the Cl, since you should only have [M+H]*. Compare this to the value you see on the LC-MS printout. How much different are they? 2. There are four isotopic peaks for the [M+H]* ion at m/z 240, 241, 242 and 243. For one point of extra credit, explain what each of these is and why they are present. 3. There is a fragment ion at m/z 184. For one point of extra credit, identify this fragment and confirm by calculating the accurate monoisotopic mass. 4. The UV spectrum is also at the bottom of your printout. For one point of extra credit, look up the UV spectrum of bupropion on Google Images and compare to your spectrum. Do they match? Cite your source. 5. For most of you, there will be a second chromatographic peak whose m/z is 74 (to a round number). For one point of extra credit, see if you can identify this molecule as well and confirm by…arrow_forwardPlease draw, not just describe!arrow_forwardcan you draw each step on a piece of a paper please this is very confusing to mearrow_forward
- > Can the molecule on the right-hand side of this organic reaction be made in good yield from no more than two reactants, in one step, by moderately heating the reactants? esc ? A O O •If your answer is yes, then draw the reactant or reactants in the drawing area below. You can draw the reactants in any arrangement you like. • If your answer is no, check the box under the drawing area instead. olo 18 Ar Explanation Check BB Click and drag to start drawing a structure. 2025 McGraw Hill LLC. All Rights Reserved. Terms of Use | Privacy Center Accessibilityarrow_forwardName the structurearrow_forward> For each pair of substrates below, choose the one that will react faster in a substitution reaction, assuming that: 1. the rate of substitution doesn't depend on nucleophile concentration and 2. the products are a roughly 50/50 mixture of enantiomers. Substrate A Substrate B Faster Rate X CI (Choose one) (Choose one) CI Br Explanation Check Br (Choose one) C 2025 McGraw Hill LLC. All Rights Reserved. Terms of Use | Privacy A F10arrow_forward
- How to draw this mechanism for the foloowing reaction in the foto. thank youarrow_forwardPredict the major products of the following organic reaction: Some important notes: CN A? • Draw the major product, or products, of the reaction in the drawing area below. • If there aren't any products, because no reaction will take place, check the box below the drawing area instead. • Be sure to use wedge and dash bonds when necessary, for example to distinguish between major products that are enantiomers. No reaction. Explanation Check Click and drag to start drawing a structure. 2025 McGraw Hill LLC. All Rights Reserved. Terms of Use Privacy Centerarrow_forwardDraw the major product of the following reaction. Do not draw inorganic byproducts. H3PO4 OHarrow_forward
- Predict the major products of this organic reaction: HBr (1 equiv) Δ ? Some important notes: • Draw the major product, or products, of this reaction in the drawing area below. • You can draw the products in any arrangement you like. • Pay careful attention to the reaction conditions, and only include the major products. • Be sure to use wedge and dash bonds when necessary, for example to distinguish between major products that are enantiomers. • Note that there is only 1 equivalent of HBr reactant, so you need not consider the case of multiple additions. Explanation Check X ©2025 McGraw Hill LLC. All Rights Reserved. Terms of Use | Privacyarrow_forwardFor the structure below, draw the resonance structure that is indicated by the curved arrow(s). Be sure to include formal charges. :ÖH Modify the second structure given to draw the new resonance structure. Include lone pairs and charges in your structure. Use the + and - tools to add/remove charges to an atom, and use the single bond tool to add/remove double bonds.arrow_forwardUsing the table of Reactants and Products provided in the Hints section, provide the major product (with the correct stereochemistry when applicable) for questions below by selecting the letter that corresponds to the exact chemical structures for the possible product. OH conc Hydrochloric acid 40°C Temp A/arrow_forward
 ChemistryChemistryISBN:9781305957404Author:Steven S. Zumdahl, Susan A. Zumdahl, Donald J. DeCostePublisher:Cengage Learning
 ChemistryChemistryISBN:9781259911156Author:Raymond Chang Dr., Jason Overby ProfessorPublisher:McGraw-Hill Education
 Principles of Instrumental AnalysisChemistryISBN:9781305577213Author:Douglas A. Skoog, F. James Holler, Stanley R. CrouchPublisher:Cengage Learning
 Organic ChemistryChemistryISBN:9780078021558Author:Janice Gorzynski Smith Dr.Publisher:McGraw-Hill Education
 Chemistry: Principles and ReactionsChemistryISBN:9781305079373Author:William L. Masterton, Cecile N. HurleyPublisher:Cengage Learning
 Elementary Principles of Chemical Processes, Bind...ChemistryISBN:9781118431221Author:Richard M. Felder, Ronald W. Rousseau, Lisa G. BullardPublisher:WILEY


