Research into cigarette-smoking habits, smoking prevention, and cessation programs necessitates accurate measurement of smoking behavior. However, decreasing social acceptability of smoking appears to cause significant underreporting. Chemical markers for cigarette use can provide objective indicators of smoking behavior. One widely used noninvasive marker is the level of saliva thiocyanate (SCN). In a Minneapolis school district, 1332 students in eighth grade (ages 12–14) participated in a study [12] whereby they (1) Viewed a film illustrating how recent cigarette use could be readily detected from small samples of saliva (2) Provided a personal sample of SCN (3) Provided a self-report of the number of cigarettes smoked per week The results are given in Table 3.10. TABLE 3.10 Relationship between SCN levels and self-reported cigarettes smoked per week Source: Based on the American Journal of Public Health , 71 (12), 1320, 1981. Suppose the self-reports are completely accurate and are representative of the number of eighth-grade students who smoke in the general community. We are considering using an SCN level ≥ 100 μ g/mL as a test criterion for identifying cigarette smokers. Regard a student as positive if he or she smokes one or more cigarettes per week. What is the sensitivity of the test for moderate-smoking students (students who smoke 15–44 cigarettes per week)?
Research into cigarette-smoking habits, smoking prevention, and cessation programs necessitates accurate measurement of smoking behavior. However, decreasing social acceptability of smoking appears to cause significant underreporting. Chemical markers for cigarette use can provide objective indicators of smoking behavior. One widely used noninvasive marker is the level of saliva thiocyanate (SCN). In a Minneapolis school district, 1332 students in eighth grade (ages 12–14) participated in a study [12] whereby they (1) Viewed a film illustrating how recent cigarette use could be readily detected from small samples of saliva (2) Provided a personal sample of SCN (3) Provided a self-report of the number of cigarettes smoked per week The results are given in Table 3.10. TABLE 3.10 Relationship between SCN levels and self-reported cigarettes smoked per week Source: Based on the American Journal of Public Health , 71 (12), 1320, 1981. Suppose the self-reports are completely accurate and are representative of the number of eighth-grade students who smoke in the general community. We are considering using an SCN level ≥ 100 μ g/mL as a test criterion for identifying cigarette smokers. Regard a student as positive if he or she smokes one or more cigarettes per week. What is the sensitivity of the test for moderate-smoking students (students who smoke 15–44 cigarettes per week)?
Solution Summary: The author calculates the sensitivity of the test for moderate-smoking students.
Research into cigarette-smoking habits, smoking prevention, and cessation programs necessitates accurate measurement of smoking behavior. However, decreasing social acceptability of smoking appears to cause significant underreporting. Chemical markers for cigarette use can provide objective indicators of smoking behavior. One widely used noninvasive marker is the level of saliva thiocyanate (SCN). In a Minneapolis school district, 1332 students in eighth grade (ages 12–14) participated in a study [12] whereby they
(1) Viewed a film illustrating how recent cigarette use could be readily detected from small samples of saliva
(2) Provided a personal sample of SCN
(3) Provided a self-report of the number of cigarettes smoked per week
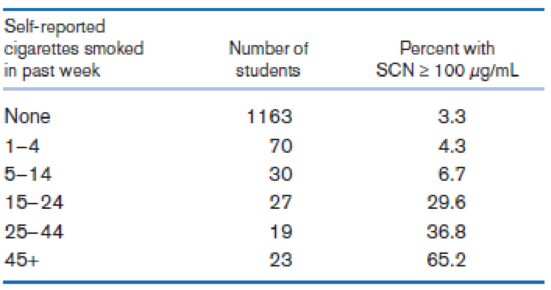
The results are given in Table 3.10.
TABLE 3.10 Relationship between SCN levels and self-reported cigarettes smoked per week
Source: Based on the American Journal of Public Health, 71(12), 1320, 1981.
Suppose the self-reports are completely accurate and are representative of the number of eighth-grade students who smoke in the general community. We are considering using an SCN level ≥ 100 μg/mL as a test criterion for identifying cigarette smokers. Regard a student as positive if he or she smokes one or more cigarettes per week.
What is the sensitivity of the test for moderate-smoking students (students who smoke 15–44 cigarettes per week)?
-
+
++
Table 2: Crack Experiment for Exercise 2
A B C D Treatment Combination
(1)
Replicate
I II
7.037
6.376
14.707 15.219
|++++ 1
བྱ॰༤༠སྦྱོ སྦྱོཋཏྟཱུ
a
b
ab
11.635 12.089
17.273 17.815
с
ас
10.403 10.151
4.368 4.098
bc
abc
9.360 9.253
13.440 12.923
d
8.561 8.951
ad
16.867 17.052
bd
13.876 13.658
abd
19.824 19.639
cd
11.846 12.337
acd
6.125
5.904
bcd
11.190 10.935
abcd
15.653 15.053
Question 3
Continuation of Exercise 2. One of the variables in the experiment described in Exercise 2, heat treatment
method (C), is a categorical variable. Assume that the remaining factors are continuous.
(a) Write two regression models for predicting crack length, one for each level of the heat treatment method
variable. What differences, if any, do you notice in these two equations?
(b) Generate appropriate response surface contour plots for the two regression models in part (a).
(c) What set of conditions would you recommend for the factors A, B, and D if you use heat treatment method
C = +?
(d) Repeat…
Question 2
A nickel-titanium alloy is used to make components for jet turbine aircraft engines. Cracking is a potentially
serious problem in the final part because it can lead to nonrecoverable failure. A test is run at the parts producer
to determine the effect of four factors on cracks. The four factors are: pouring temperature (A), titanium content
(B), heat treatment method (C), amount of grain refiner used (D). Two replicates of a 24 design are run, and
the length of crack (in mm x10-2) induced in a sample coupon subjected to a standard test is measured. The
data are shown in Table 2.
1
(a) Estimate the factor effects. Which factor effects appear to be large?
(b) Conduct an analysis of variance. Do any of the factors affect cracking? Use a = 0.05.
(c) Write down a regression model that can be used to predict crack length as a function of the significant
main effects and interactions you have identified in part (b).
(d) Analyze the residuals from this experiment.
(e) Is there an…
A 24-1 design has been used to investigate the effect of four factors on the resistivity of a silicon wafer. The data
from this experiment are shown in Table 4.
Table 4: Resistivity Experiment for Exercise 5
Run
A
B
с
D
Resistivity
1
23
2
3
4
5
6
7
8
9
10
11
12
I+I+I+I+Oooo
0
0
||++TI++o000
33.2
4.6
31.2
9.6
40.6
162.4
39.4
158.6
63.4
62.6
58.7
0
0
60.9
3
(a) Estimate the factor effects. Plot the effect estimates on a normal probability scale.
(b) Identify a tentative model for this process. Fit the model and test for curvature.
(c) Plot the residuals from the model in part (b) versus the predicted resistivity. Is there any indication on
this plot of model inadequacy?
(d) Construct a normal probability plot of the residuals. Is there any reason to doubt the validity of the
normality assumption?
Need a deep-dive on the concept behind this application? Look no further. Learn more about this topic, statistics and related others by exploring similar questions and additional content below.
Hypothesis Testing - Solving Problems With Proportions; Author: The Organic Chemistry Tutor;https://www.youtube.com/watch?v=76VruarGn2Q;License: Standard YouTube License, CC-BY
Hypothesis Testing and Confidence Intervals (FRM Part 1 – Book 2 – Chapter 5); Author: Analystprep;https://www.youtube.com/watch?v=vth3yZIUlGQ;License: Standard YouTube License, CC-BY


 Glencoe Algebra 1, Student Edition, 9780079039897...AlgebraISBN:9780079039897Author:CarterPublisher:McGraw Hill
 College Algebra (MindTap Course List)AlgebraISBN:9781305652231Author:R. David Gustafson, Jeff HughesPublisher:Cengage Learning
 Big Ideas Math A Bridge To Success Algebra 1: Stu...AlgebraISBN:9781680331141Author:HOUGHTON MIFFLIN HARCOURTPublisher:Houghton Mifflin Harcourt