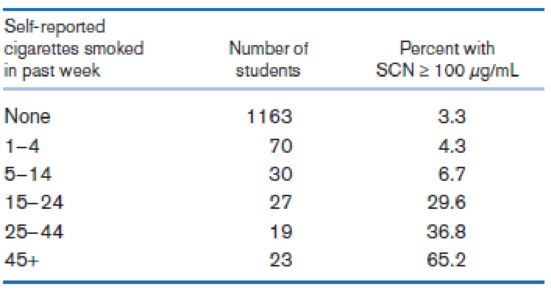
Research into cigarette-smoking habits, smoking prevention, and cessation programs necessitates accurate measurement of smoking behavior. However, decreasing social acceptability of smoking appears to cause significant underreporting. Chemical markers for cigarette use can provide objective indicators of smoking behavior. One widely used noninvasive marker is the level of saliva thiocyanate (SCN). In a Minneapolis school district, 1332 students in eighth grade (ages 12–14) participated in a study [12] whereby they (1) Viewed a film illustrating how recent cigarette use could be readily detected from small samples of saliva (2) Provided a personal sample of SCN (3) Provided a self-report of the number of cigarettes smoked per week The results are given in Table 3.10. TABLE 3.10 Relationship between SCN levels and self-reported cigarettes smoked per week Source: Based on the American Journal of Public Health , 71 (12), 1320, 1981. Suppose the self-reports are completely accurate and are representative of the number of eighth-grade students who smoke in the general community. We are considering using an SCN level ≥ 100 μ g/mL as a test criterion for identifying cigarette smokers. Regard a student as positive if he or she smokes one or more cigarettes per week. What is the PV + of the test?
Research into cigarette-smoking habits, smoking prevention, and cessation programs necessitates accurate measurement of smoking behavior. However, decreasing social acceptability of smoking appears to cause significant underreporting. Chemical markers for cigarette use can provide objective indicators of smoking behavior. One widely used noninvasive marker is the level of saliva thiocyanate (SCN). In a Minneapolis school district, 1332 students in eighth grade (ages 12–14) participated in a study [12] whereby they (1) Viewed a film illustrating how recent cigarette use could be readily detected from small samples of saliva (2) Provided a personal sample of SCN (3) Provided a self-report of the number of cigarettes smoked per week The results are given in Table 3.10. TABLE 3.10 Relationship between SCN levels and self-reported cigarettes smoked per week Source: Based on the American Journal of Public Health , 71 (12), 1320, 1981. Suppose the self-reports are completely accurate and are representative of the number of eighth-grade students who smoke in the general community. We are considering using an SCN level ≥ 100 μ g/mL as a test criterion for identifying cigarette smokers. Regard a student as positive if he or she smokes one or more cigarettes per week. What is the PV + of the test?
Research into cigarette-smoking habits, smoking prevention, and cessation programs necessitates accurate measurement of smoking behavior. However, decreasing social acceptability of smoking appears to cause significant underreporting. Chemical markers for cigarette use can provide objective indicators of smoking behavior. One widely used noninvasive marker is the level of saliva thiocyanate (SCN). In a Minneapolis school district, 1332 students in eighth grade (ages 12–14) participated in a study [12] whereby they
(1) Viewed a film illustrating how recent cigarette use could be readily detected from small samples of saliva
(2) Provided a personal sample of SCN
(3) Provided a self-report of the number of cigarettes smoked per week
The results are given in Table 3.10.
TABLE 3.10 Relationship between SCN levels and self-reported cigarettes smoked per week
Source: Based on the American Journal of Public Health, 71(12), 1320, 1981.
Suppose the self-reports are completely accurate and are representative of the number of eighth-grade students who smoke in the general community. We are considering using an SCN level ≥ 100 μg/mL as a test criterion for identifying cigarette smokers. Regard a student as positive if he or she smokes one or more cigarettes per week.
Find the critical value for a left-tailed test using the F distribution with a 0.025, degrees of freedom in the numerator=12, and degrees of freedom in the
denominator = 50. A portion of the table of critical values of the F-distribution is provided.
Click the icon to view the partial table of critical values of the F-distribution.
What is the critical value?
(Round to two decimal places as needed.)
A retail store manager claims that the average daily sales of the store are $1,500.
You aim to test whether the actual average daily sales differ significantly from this claimed value.
You can provide your answer by inserting a text box and the answer must include:
Null hypothesis,
Alternative hypothesis,
Show answer (output table/summary table), and
Conclusion based on the P value.
Showing the calculation is a must. If calculation is missing,so please provide a step by step on the answers
Numerical answers in the yellow cells
Need a deep-dive on the concept behind this application? Look no further. Learn more about this topic, statistics and related others by exploring similar questions and additional content below.
Hypothesis Testing - Solving Problems With Proportions; Author: The Organic Chemistry Tutor;https://www.youtube.com/watch?v=76VruarGn2Q;License: Standard YouTube License, CC-BY
Hypothesis Testing and Confidence Intervals (FRM Part 1 – Book 2 – Chapter 5); Author: Analystprep;https://www.youtube.com/watch?v=vth3yZIUlGQ;License: Standard YouTube License, CC-BY


 Glencoe Algebra 1, Student Edition, 9780079039897...AlgebraISBN:9780079039897Author:CarterPublisher:McGraw Hill
 College Algebra (MindTap Course List)AlgebraISBN:9781305652231Author:R. David Gustafson, Jeff HughesPublisher:Cengage Learning
 Big Ideas Math A Bridge To Success Algebra 1: Stu...AlgebraISBN:9781680331141Author:HOUGHTON MIFFLIN HARCOURTPublisher:Houghton Mifflin Harcourt