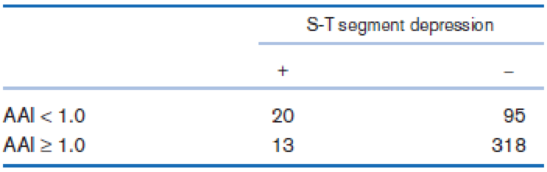
Cardiovascular Disease The ankle-arm blood-pressure index (AAI) is defined as the ratio of ankle systolic blood pressure/arm systolic blood pressure and is used for the diagnosis of lower extremity arterial disease. A study was conducted to investigate whether the AAI can be used as a screening test for atherosclerotic diseases in general [20]. The subjects were 446 male workers in a copper smelter in Japan. Each subject had an AAI determination as well as an electrocardiogram (ECG). From the ECG, an S-T segment depression was defined as an S-T segment ≥ 0.1 mV below the baseline in at least 1 of 12 leads in a resting ECG. S-T segment depression is often used as one characterization of an abnormal ECG. The data in Table 3.22 were presented relating AAI to S-T segment depression. Table 3.22 Association between ankle-arm blood-pressure index (AAI) and S-T segment depression What is the PV + ? ( Hint : Assume that the subjects in this study are a random sample from the general population of Japan.)
Cardiovascular Disease The ankle-arm blood-pressure index (AAI) is defined as the ratio of ankle systolic blood pressure/arm systolic blood pressure and is used for the diagnosis of lower extremity arterial disease. A study was conducted to investigate whether the AAI can be used as a screening test for atherosclerotic diseases in general [20]. The subjects were 446 male workers in a copper smelter in Japan. Each subject had an AAI determination as well as an electrocardiogram (ECG). From the ECG, an S-T segment depression was defined as an S-T segment ≥ 0.1 mV below the baseline in at least 1 of 12 leads in a resting ECG. S-T segment depression is often used as one characterization of an abnormal ECG. The data in Table 3.22 were presented relating AAI to S-T segment depression. Table 3.22 Association between ankle-arm blood-pressure index (AAI) and S-T segment depression What is the PV + ? ( Hint : Assume that the subjects in this study are a random sample from the general population of Japan.)
Solution Summary: The author explains that the PV+ is 0.174. Predictive value positive is defined as ankle-arm blood-pressure index less than 1.0, and S-T segment depression positive.
The ankle-arm blood-pressure index (AAI) is defined as the ratio of ankle systolic blood pressure/arm systolic blood pressure and is used for the diagnosis of lower extremity arterial disease. A study was conducted to investigate whether the AAI can be used as a screening test for atherosclerotic diseases in general [20]. The subjects were 446 male workers in a copper smelter in Japan. Each subject had an AAI determination as well as an electrocardiogram (ECG). From the ECG, an S-T segment depression was defined as an S-T segment ≥ 0.1 mV below the baseline in at least 1 of 12 leads in a resting ECG. S-T segment depression is often used as one characterization of an abnormal ECG. The data in Table 3.22 were presented relating AAI to S-T segment depression.
Table 3.22 Association between ankle-arm blood-pressure index (AAI) and S-T segment depression
What is the PV+? (Hint: Assume that the subjects in this study are a random sample from the general population of Japan.)
Compute the median of the following data.
32, 41, 36, 42, 29, 30, 40, 22, 25, 37
Task Description:
Read the following case study and answer the questions that follow.
Ella is a 9-year-old third-grade student in an inclusive classroom. She has been diagnosed with Emotional and Behavioural Disorder (EBD). She has been struggling academically and socially due to
challenges related to self-regulation, impulsivity, and emotional outbursts. Ella's behaviour includes frequent tantrums, defiance toward authority figures, and difficulty forming positive relationships with peers. Despite her challenges, Ella shows an interest in art and creative activities and demonstrates strong verbal skills when calm.
Describe 2 strategies that could be implemented that could help Ella regulate her emotions in class (4 marks)
Explain 2 strategies that could improve Ella’s social skills (4 marks)
Identify 2 accommodations that could be implemented to support Ella academic progress and provide a rationale for your recommendation.(6 marks)
Provide a detailed explanation of 2 ways…
Question 2: When John started his first job, his first end-of-year salary was $82,500. In the following years, he received salary raises as shown in the following table.
Fill the Table: Fill the following table showing his end-of-year salary for each year. I have already provided the end-of-year salaries for the first three years. Calculate the end-of-year salaries for the remaining years using Excel. (If you Excel answer for the top 3 cells is not the same as the one in the following table, your formula / approach is incorrect) (2 points)
Geometric Mean of Salary Raises: Calculate the geometric mean of the salary raises using the percentage figures provided in the second column named “% Raise”. (The geometric mean for this calculation should be nearly identical to the arithmetic mean. If your answer deviates significantly from the mean, it's likely incorrect. 2 points)
Starting salary
% Raise
Raise
Salary after raise
75000
10%
7500
82500
82500
4%
3300…
Need a deep-dive on the concept behind this application? Look no further. Learn more about this topic, statistics and related others by exploring similar questions and additional content below.
Hypothesis Testing - Solving Problems With Proportions; Author: The Organic Chemistry Tutor;https://www.youtube.com/watch?v=76VruarGn2Q;License: Standard YouTube License, CC-BY
Hypothesis Testing and Confidence Intervals (FRM Part 1 – Book 2 – Chapter 5); Author: Analystprep;https://www.youtube.com/watch?v=vth3yZIUlGQ;License: Standard YouTube License, CC-BY


 Glencoe Algebra 1, Student Edition, 9780079039897...AlgebraISBN:9780079039897Author:CarterPublisher:McGraw Hill
 Holt Mcdougal Larson Pre-algebra: Student Edition...AlgebraISBN:9780547587776Author:HOLT MCDOUGALPublisher:HOLT MCDOUGAL
 Big Ideas Math A Bridge To Success Algebra 1: Stu...AlgebraISBN:9781680331141Author:HOUGHTON MIFFLIN HARCOURTPublisher:Houghton Mifflin Harcourt