Pulmonary Disease Research into cigarette-smoking habits, smoking prevention, and cessation programs necessitates accurate measurement of smoking behavior. However, decreasing social acceptability of smoking appears to cause significant underreporting. Chemical markers for cigarette use can provide objective indicators of smoking behavior. One widely used noninvasive marker is the level of saliva thiocyanate (SCN). In a Minneapolis school district, 1332 students in eighth grade (ages 12–14) participated in a study [12] whereby they (1) Viewed a film illustrating how recent cigarette use could be readily detected from small samples of saliva (2) Provided a personal sample of SCN (3) Provided a self-report of the number of cigarettes smoked per week The results are given in Table 3.10. Table 3.10 Relationship between SCN levels and self-reported cigarettes smoked per week Suppose the self-reports are completely accurate and are representative of the number of eighth-grade students who smoke in the general community. We are considering using an SCN level ≥ 100 μ g/mL as a test criterion for identifying cigarette smokers. Regard a student as positive if he or she smokes one or more cigarettes per week. Suppose we regard the self-reports of all students who report some cigarette consumption as valid but estimate that 20% of students who report no cigarette consumption actually smoke 1–4 cigarettes per week and an additional 10% smoke 5–14 cigarettes per week. Compute the PV − under these altered assumptions. How does the true PV − using a screening criterion of SCN ≥ 100 μg/mL for identifying smokers compare with the PV − based on self-reports obtained in Problem 3.73? 3.73 What is the PV − of the test?
Pulmonary Disease Research into cigarette-smoking habits, smoking prevention, and cessation programs necessitates accurate measurement of smoking behavior. However, decreasing social acceptability of smoking appears to cause significant underreporting. Chemical markers for cigarette use can provide objective indicators of smoking behavior. One widely used noninvasive marker is the level of saliva thiocyanate (SCN). In a Minneapolis school district, 1332 students in eighth grade (ages 12–14) participated in a study [12] whereby they (1) Viewed a film illustrating how recent cigarette use could be readily detected from small samples of saliva (2) Provided a personal sample of SCN (3) Provided a self-report of the number of cigarettes smoked per week The results are given in Table 3.10. Table 3.10 Relationship between SCN levels and self-reported cigarettes smoked per week Suppose the self-reports are completely accurate and are representative of the number of eighth-grade students who smoke in the general community. We are considering using an SCN level ≥ 100 μ g/mL as a test criterion for identifying cigarette smokers. Regard a student as positive if he or she smokes one or more cigarettes per week. Suppose we regard the self-reports of all students who report some cigarette consumption as valid but estimate that 20% of students who report no cigarette consumption actually smoke 1–4 cigarettes per week and an additional 10% smoke 5–14 cigarettes per week. Compute the PV − under these altered assumptions. How does the true PV − using a screening criterion of SCN ≥ 100 μg/mL for identifying smokers compare with the PV − based on self-reports obtained in Problem 3.73? 3.73 What is the PV − of the test?
Research into cigarette-smoking habits, smoking prevention, and cessation programs necessitates accurate measurement of smoking behavior. However, decreasing social acceptability of smoking appears to cause significant underreporting. Chemical markers for cigarette use can provide objective indicators of smoking behavior. One widely used noninvasive marker is the level of saliva thiocyanate (SCN). In a Minneapolis school district, 1332 students in eighth grade (ages 12–14) participated in a study [12] whereby they
(1) Viewed a film illustrating how recent cigarette use could be readily detected from small samples of saliva
(2) Provided a personal sample of SCN
(3) Provided a self-report of the number of cigarettes smoked per week
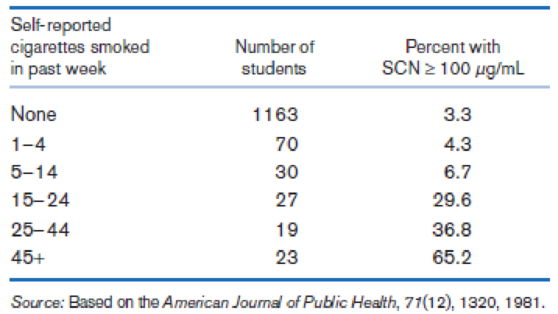
The results are given in Table 3.10.
Table 3.10 Relationship between SCN levels and self-reported cigarettes smoked per week
Suppose the self-reports are completely accurate and are representative of the number of eighth-grade students who smoke in the general community. We are considering using an SCN level ≥ 100 μg/mL as a test criterion for identifying cigarette smokers. Regard a student as positive if he or she smokes one or more cigarettes per week.
Suppose we regard the self-reports of all students who report some cigarette consumption as valid but estimate that 20% of students who report no cigarette consumption actually smoke 1–4 cigarettes per week and an additional 10% smoke 5–14 cigarettes per week.
Compute the PV− under these altered assumptions. How does the true PV− using a screening criterion of SCN ≥ 100 μg/mL for identifying smokers compare with the PV− based on self-reports obtained in Problem 3.73?
The following data represent total ventilation measured in liters of air per minute per square meter of body area for two independent (and randomly chosen) samples.
Analyze these data using the appropriate non-parametric hypothesis test
each column represents before & after measurements on the same individual. Analyze with the appropriate non-parametric hypothesis test for a paired design.
Should you be confident in applying your regression equation to estimate the heart rate of a python at 35°C? Why or why not?
Need a deep-dive on the concept behind this application? Look no further. Learn more about this topic, statistics and related others by exploring similar questions and additional content below.
Hypothesis Testing - Solving Problems With Proportions; Author: The Organic Chemistry Tutor;https://www.youtube.com/watch?v=76VruarGn2Q;License: Standard YouTube License, CC-BY
Hypothesis Testing and Confidence Intervals (FRM Part 1 – Book 2 – Chapter 5); Author: Analystprep;https://www.youtube.com/watch?v=vth3yZIUlGQ;License: Standard YouTube License, CC-BY


 Glencoe Algebra 1, Student Edition, 9780079039897...AlgebraISBN:9780079039897Author:CarterPublisher:McGraw Hill
 College Algebra (MindTap Course List)AlgebraISBN:9781305652231Author:R. David Gustafson, Jeff HughesPublisher:Cengage Learning
 Big Ideas Math A Bridge To Success Algebra 1: Stu...AlgebraISBN:9781680331141Author:HOUGHTON MIFFLIN HARCOURTPublisher:Houghton Mifflin Harcourt