Commonly used vaccines for influenza are trivalent and contain only one type of influenza B virus. They may be ineffective against other types of influenza B virus. A randomized clinical trial was performed among children 3 to 8 years of age in 8 countries. Children received either a quadrivalent vaccine (QIV) that had more than one influenza B virus or a trivalent Hepatitis A vaccine (control) (Jain, et al., [9]. New England Journal of Medicine 2013: 369(26): 2481–2491). An attack rate (i.e.,% of children who developed influenza) starting 14 days after vaccination until the end of the study was computed for each vaccine group, stratified by age. The following data were reported: Table 3.7 Attack rate for influenza by age and treatment group Suppose 3 children in a village ages 3, 5, and 7 are vaccinated with the QIV vaccine. What is the probability that at least one child among the 3 will get influenza?
Commonly used vaccines for influenza are trivalent and contain only one type of influenza B virus. They may be ineffective against other types of influenza B virus. A randomized clinical trial was performed among children 3 to 8 years of age in 8 countries. Children received either a quadrivalent vaccine (QIV) that had more than one influenza B virus or a trivalent Hepatitis A vaccine (control) (Jain, et al., [9]. New England Journal of Medicine 2013: 369(26): 2481–2491). An attack rate (i.e.,% of children who developed influenza) starting 14 days after vaccination until the end of the study was computed for each vaccine group, stratified by age. The following data were reported: Table 3.7 Attack rate for influenza by age and treatment group Suppose 3 children in a village ages 3, 5, and 7 are vaccinated with the QIV vaccine. What is the probability that at least one child among the 3 will get influenza?
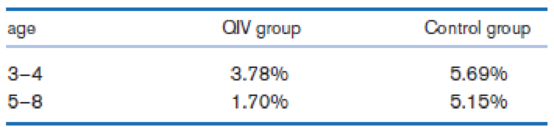
Commonly used vaccines for influenza are trivalent and contain only one type of influenza B virus. They may be ineffective against other types of influenza B virus. A randomized clinical trial was performed among children 3 to 8 years of age in 8 countries. Children received either a quadrivalent vaccine (QIV) that had more than one influenza B virus or a trivalent Hepatitis A vaccine (control) (Jain, et al., [9]. New England Journal of Medicine 2013: 369(26): 2481–2491). An attack rate (i.e.,% of children who developed influenza) starting 14 days after vaccination until the end of the study was computed for each vaccine group, stratified by age. The following data were reported:
Table 3.7 Attack rate for influenza by age and treatment group
Suppose 3 children in a village ages 3, 5, and 7 are vaccinated with the QIV vaccine. What is the probability that at least one child among the 3 will get influenza?
A researcher wishes to estimate, with 90% confidence, the population proportion of adults who support labeling
legislation for genetically modified organisms (GMOs). Her estimate must be accurate within 4% of the true proportion.
(a) No preliminary estimate is available. Find the minimum sample size needed.
(b) Find the minimum sample size needed, using a prior study that found that 65% of the respondents said they support
labeling legislation for GMOs.
(c) Compare the results from parts (a) and (b).
...
(a) What is the minimum sample size needed assuming that no prior information is available?
n =
(Round up to the nearest whole number as needed.)
The table available below shows the costs per mile (in cents) for a sample of automobiles. At a = 0.05, can you conclude that at least one mean
cost per mile is different from the others?
Click on the icon to view the data table.
Let Hss, HMS, HLS, Hsuv and Hмy represent the mean costs per mile for small sedans, medium sedans, large sedans, SUV 4WDs, and minivans
respectively. What are the hypotheses for this test?
OA. Ho: Not all the means are equal.
Ha Hss HMS HLS HSUV HMV
B. Ho Hss HMS HLS HSUV = μMV
Ha: Hss *HMS *HLS*HSUV * HMV
C. Ho Hss HMS HLS HSUV =μMV
= =
H: Not all the means are equal.
D. Ho Hss HMS
HLS HSUV HMV
Ha Hss HMS
HLS =HSUV = HMV
Question: A company launches two different marketing campaigns to promote the same product in two different regions. After one month, the company collects the sales data (in units sold) from both regions to compare the effectiveness of the campaigns.
The company wants to determine whether there is a significant difference in the mean sales between the two regions. Perform a two sample T-test
You can provide your answer by inserting a text box and the answer must include:
Null hypothesis,
Alternative hypothesis,
Show answer (output table/summary table), and
Conclusion based on the P value.
(2 points = 0.5 x 4 Answers)
Each of these is worth 0.5 points. However, showing the calculation is must. If calculation is missing, the whole answer won't get any credit.
Need a deep-dive on the concept behind this application? Look no further. Learn more about this topic, statistics and related others by exploring similar questions and additional content below.
Introduction to experimental design and analysis of variance (ANOVA); Author: Dr. Bharatendra Rai;https://www.youtube.com/watch?v=vSFo1MwLoxU;License: Standard YouTube License, CC-BY


 College Algebra (MindTap Course List)AlgebraISBN:9781305652231Author:R. David Gustafson, Jeff HughesPublisher:Cengage Learning