Radiology Mobile displays have the potential to increase the flexibility of consulting radiologists if they can be shown to be comparable to traditional display modalities. A study was performed comparing a mobile display iPad 2 with a larger liquid crystal display (LCD) for the diagnosis of tuberculosis (TB) on chest radiography (Abboud et al., [19]). De-identified images of 240 chest X-rays were transferred from a PACS workstation (LCD) to an iPad 2 tablet. The images were reviewed independently by 5 radiologists and were graded as positive or negative for TB on both the LCD and the iPad 2. The reviews occurred at different times to avoid recall bias. A database of > 500 chest X-rays was created from TB screening films over a 4-month period. Of these, 200 cases originally interpreted as TB-negative and 40 cases originally interpreted as TB-positive were selected at random for study. The images were re-reviewed using both an LCD and an iPad 2 imaging display, albeit at different times. The results were as shown in Table 3.21. Table 3.21 Comparison of TB screening results using an LCD and iPad 2 display The selection of images for this study was enriched to increase the number of images originally interpreted as positive. Suppose the underlying percentage of positive TB tests is 10% in a large sample of chest X-rays assessed by LCD. If a subject tests positive on an iPad 2 display, then what is the probability that he(she) will also test positive on the LCD?
Radiology Mobile displays have the potential to increase the flexibility of consulting radiologists if they can be shown to be comparable to traditional display modalities. A study was performed comparing a mobile display iPad 2 with a larger liquid crystal display (LCD) for the diagnosis of tuberculosis (TB) on chest radiography (Abboud et al., [19]). De-identified images of 240 chest X-rays were transferred from a PACS workstation (LCD) to an iPad 2 tablet. The images were reviewed independently by 5 radiologists and were graded as positive or negative for TB on both the LCD and the iPad 2. The reviews occurred at different times to avoid recall bias. A database of > 500 chest X-rays was created from TB screening films over a 4-month period. Of these, 200 cases originally interpreted as TB-negative and 40 cases originally interpreted as TB-positive were selected at random for study. The images were re-reviewed using both an LCD and an iPad 2 imaging display, albeit at different times. The results were as shown in Table 3.21. Table 3.21 Comparison of TB screening results using an LCD and iPad 2 display The selection of images for this study was enriched to increase the number of images originally interpreted as positive. Suppose the underlying percentage of positive TB tests is 10% in a large sample of chest X-rays assessed by LCD. If a subject tests positive on an iPad 2 display, then what is the probability that he(she) will also test positive on the LCD?
Solution Summary: The author calculates the probability that test positive on an iPad 2 display is 0.956. If A_1,mathrm...
Mobile displays have the potential to increase the flexibility of consulting radiologists if they can be shown to be comparable to traditional display modalities. A study was performed comparing a mobile display iPad 2 with a larger liquid crystal display (LCD) for the diagnosis of tuberculosis (TB) on chest radiography (Abboud et al., [19]). De-identified images of 240 chest X-rays were transferred from a PACS workstation (LCD) to an iPad 2 tablet. The images were reviewed independently by 5 radiologists and were graded as positive or negative for TB on both the LCD and the iPad 2. The reviews occurred at different times to avoid recall bias.
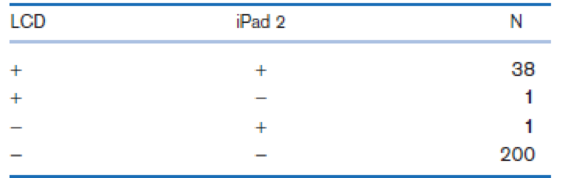
A database of > 500 chest X-rays was created from TB screening films over a 4-month period. Of these, 200 cases originally interpreted as TB-negative and 40 cases originally interpreted as TB-positive were selected at random for study. The images were re-reviewed using both an LCD and an iPad 2 imaging display, albeit at different times. The results were as shown in Table 3.21.
Table 3.21 Comparison of TB screening results using an LCD and iPad 2 display
The selection of images for this study was enriched to increase the number of images originally interpreted as positive. Suppose the underlying percentage of positive TB tests is 10% in a large sample of chest X-rays assessed by LCD.
If a subject tests positive on an iPad 2 display, then what is the probability that he(she) will also test positive on the LCD?
NC Current Students - North Ce X | NC Canvas Login Links - North ( X
Final Exam Comprehensive x Cengage Learning
x
WASTAT - Final Exam - STAT
→
C
webassign.net/web/Student/Assignment-Responses/submit?dep=36055360&tags=autosave#question3659890_9
Part (b)
Draw a scatter plot of the ordered pairs.
N
Life
Expectancy
Life
Expectancy
80
70
600
50
40
30
20
10
Year of
1950
1970 1990
2010 Birth
O
Life
Expectancy
Part (c)
800
70
60
50
40
30
20
10
1950
1970 1990
W
ALT
林
$
#
4
R
J7
Year of
2010 Birth
F6
4+
80
70
60
50
40
30
20
10
Year of
1950 1970 1990
2010 Birth
Life
Expectancy
Ox
800
70
60
50
40
30
20
10
Year of
1950 1970 1990 2010 Birth
hp
P.B.
KA
&
7
80
% 5
H
A
B
F10
711
N
M
K
744
PRT SC
ALT
CTRL
Need a deep-dive on the concept behind this application? Look no further. Learn more about this topic, statistics and related others by exploring similar questions and additional content below.
Introduction to experimental design and analysis of variance (ANOVA); Author: Dr. Bharatendra Rai;https://www.youtube.com/watch?v=vSFo1MwLoxU;License: Standard YouTube License, CC-BY


 Big Ideas Math A Bridge To Success Algebra 1: Stu...AlgebraISBN:9781680331141Author:HOUGHTON MIFFLIN HARCOURTPublisher:Houghton Mifflin Harcourt
 Linear Algebra: A Modern IntroductionAlgebraISBN:9781285463247Author:David PoolePublisher:Cengage Learning