
EBK FUNDAMENTALS OF BIOSTATISTICS
8th Edition
ISBN: 9781305465510
Author: Rosner
Publisher: YUZU
expand_more
expand_more
format_list_bulleted
Concept explainers
Videos
Textbook Question
Chapter 3, Problem 122P
Cancer
Breast cancer is considered largely a hormonal disease. An important hormone in breast-cancer research is estradiol. The data in Table 3.18 on serum estradiol levels were obtained from 213 breast-cancer cases and 432 agematched controls. All women were age 50–59 years.
Suppose a serum-estradiol level of 20+ pg/mL is proposed as a screening criterion for identifying breast-cancer cases.
Table 3.18 Serum-estradiol data
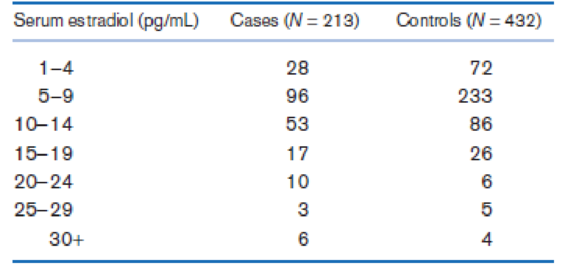
What is the sensitivity of this test?
Expert Solution & Answer
Want to see the full answer?
Check out a sample textbook solution
Students have asked these similar questions
Show all work
Show all work
Show all work
Chapter 3 Solutions
EBK FUNDAMENTALS OF BIOSTATISTICS
Ch. 3.6 - What is the frequency definition of probability?Ch. 3.6 - What is the difference between independent and...Ch. 3.6 - What are mutually exclusive events?Ch. 3.6 - What is the addition law of probability?Ch. 3.6 - What is conditional probability? How does it...Ch. 3.6 - What is relative risk? How do you interpret it?Ch. 3.6 - Prob. B.1RECh. 3.6 - Suppose the rate of type II diabetes mellitus (DM)...Ch. 3.7 - What is the sensitivity and specificity of a...Ch. 3.7 - What are the PV+ and PV of a screening test? How...
Ch. 3.7 - Prob. C.3RECh. 3.7 - What is Bayes rule? How is it used?Ch. 3.7 - Prob. D.2RECh. 3.7 - Prob. D.3RECh. 3.7 - Prob. D.4RECh. 3.10 - Suppose that of 25 students in a class, 5 are...Ch. 3.10 - Suppose 50 HIV-positive men are identified, 5 of...Ch. 3 - Consider a family with a mother, father, and two...Ch. 3 - Consider a family with a mother, father, and two...Ch. 3 - Consider a family with a mother, father, and two...Ch. 3 - Consider a family with a mother, father, and two...Ch. 3 - Consider a family with a mother, father, and two...Ch. 3 - Consider a family with a mother, father, and two...Ch. 3 - Consider a family with a mother, father, and two...Ch. 3 - Consider a family with a mother, father, and two...Ch. 3 - Consider a family with a mother, father, and two...Ch. 3 - Consider a family with a mother, father, and two...Ch. 3 - Prob. 11PCh. 3 - Suppose an influenza epidemic strikes a city. In...Ch. 3 - Suppose there is a 20% chance each child will get...Ch. 3 - Suppose there is a 20% chance each child will get...Ch. 3 - Suppose there is a 20% chance each child will get...Ch. 3 - Mental Health Estimates of the prevalence of...Ch. 3 - Mental Health Estimates of the prevalence of...Ch. 3 - Mental Health Estimates of the prevalence of...Ch. 3 - Mental Health Estimates of the prevalence of...Ch. 3 - Estimates of the prevalence of Alzheimers disease...Ch. 3 - Estimates of the prevalence of Alzheimers disease...Ch. 3 - Estimates of the prevalence of Alzheimers disease...Ch. 3 - Estimates of the prevalence of Alzheimers disease...Ch. 3 - Estimates of the prevalence of Alzheimers disease...Ch. 3 - Estimates of the prevalence of Alzheimers disease...Ch. 3 - Suppose a study of Alzheimers disease is proposed...Ch. 3 - Suppose a study of Alzheimers disease is proposed...Ch. 3 - Commonly used vaccines for influenza are trivalent...Ch. 3 - Prob. 29PCh. 3 - Prob. 30PCh. 3 - Prob. 31PCh. 3 - Genetics Suppose that a disease is inherited via a...Ch. 3 - Genetics Suppose that a disease is inherited via a...Ch. 3 - Genetics Suppose that a disease is inherited via a...Ch. 3 - Prob. 35PCh. 3 - Prob. 36PCh. 3 - Suppose that a disease is inherited via an...Ch. 3 - Suppose that a disease is inherited via an...Ch. 3 - Prob. 39PCh. 3 - Suppose that a disease is inherited via a...Ch. 3 - Suppose that a disease is inherited via a...Ch. 3 - Suppose that a disease is inherited via a...Ch. 3 - Suppose that a disease is inherited via a...Ch. 3 - Prob. 44PCh. 3 - Prob. 45PCh. 3 - Prob. 46PCh. 3 - Prob. 47PCh. 3 - Prob. 48PCh. 3 - Prob. 49PCh. 3 - Obstetrics The following data are derived from the...Ch. 3 - Obstetrics The following data are derived from the...Ch. 3 - Obstetrics The following data are derived from the...Ch. 3 - Pulmonary Disease The familial aggregation of...Ch. 3 - Pulmonary Disease The familial aggregation of...Ch. 3 - Suppose, alternatively, that if the father is a...Ch. 3 - Suppose, alternatively, that if the father is a...Ch. 3 - Prob. 57PCh. 3 - The familial aggregation of respiratory disease is...Ch. 3 - The familial aggregation of respiratory disease is...Ch. 3 - The familial aggregation of respiratory disease is...Ch. 3 - The familial aggregation of respiratory disease is...Ch. 3 - Pulmonary Disease The familial aggregation of...Ch. 3 - Pulmonary Disease The familial aggregation of...Ch. 3 - Genetics, Obstetrics Precise quantification of...Ch. 3 - Precise quantification of smoking during pregnancy...Ch. 3 - Precise quantification of smoking during pregnancy...Ch. 3 - What is another name for this quantity? Suppose it...Ch. 3 - Research into cigarette-smoking habits, smoking...Ch. 3 - Research into cigarette-smoking habits, smoking...Ch. 3 - Research into cigarette-smoking habits, smoking...Ch. 3 - Research into cigarette-smoking habits, smoking...Ch. 3 - Research into cigarette-smoking habits, smoking...Ch. 3 - Research into cigarette-smoking habits, smoking...Ch. 3 - Pulmonary Disease Research into cigarette-smoking...Ch. 3 - Pulmonary Disease Research into cigarette-smoking...Ch. 3 - Laboratory measures of cardiovascular reactivity...Ch. 3 - Laboratory measures of cardiovascular reactivity...Ch. 3 - Laboratory measures of cardiovascular reactivity...Ch. 3 - The data set in Table 3.12 is based on 214...Ch. 3 - The data set in Table 3.12 is based on 214...Ch. 3 - The data set in Table 3.12 is based on 214...Ch. 3 - A drug company is developing a new pregnancy-test...Ch. 3 - A drug company is developing a new pregnancy-test...Ch. 3 - A drug company is developing a new pregnancy-test...Ch. 3 - Gynecology A drug company is developing a new...Ch. 3 - The Chinese Mini-Mental Status Test (CMMS)...Ch. 3 - The Chinese Mini-Mental Status Test (CMMS)...Ch. 3 - Mental Health The Chinese Mini-Mental Status Test...Ch. 3 - Construct an ROC curve based on the table...Ch. 3 - Mental Health The Chinese Mini-Mental Status Test...Ch. 3 - Calculate the area under the ROC curve. Interpret...Ch. 3 - Demography A study based on data collected from...Ch. 3 - Prob. 94PCh. 3 - Demography A study based on data collected from...Ch. 3 - Demography A study based on data collected from...Ch. 3 - Prob. 97PCh. 3 - The 4 allele of the gene encoding apolipoprotein E...Ch. 3 - Mental Health The 4 allele of the gene encoding...Ch. 3 - Mental Health The 4 allele of the gene encoding...Ch. 3 - Cardiovascular Disease A fascinating subject of...Ch. 3 - Cardiovascular Disease A fascinating subject of...Ch. 3 - Are these proportions prevalence rates, incidence...Ch. 3 - Prob. 104PCh. 3 - A dominantly inherited genetic disease is...Ch. 3 - A dominantly inherited genetic disease is...Ch. 3 - Prob. 107PCh. 3 - Infectious Disease, Cardiovascular Disease A...Ch. 3 - Infectious Disease, Cardiovascular Disease A...Ch. 3 - Infectious Disease, Cardiovascular Disease A...Ch. 3 - Prob. 114PCh. 3 - Genetics Suppose a birth defect has a recessive...Ch. 3 - A further study finds that after 10 generations...Ch. 3 - A further study finds that after 10 generations...Ch. 3 - Orthopedics Piriformis syndrome is a pelvic...Ch. 3 - Prob. 119PCh. 3 - Orthopedics Piriformis syndrome is a pelvic...Ch. 3 - Prob. 121PCh. 3 - Cancer Breast cancer is considered largely a...Ch. 3 - Cancer Breast cancer is considered largely a...Ch. 3 - Cancer Breast cancer is considered largely a...Ch. 3 - Prob. 125PCh. 3 - Cardiovascular Disease Mayo Clinic investigators...Ch. 3 - Prob. 127PCh. 3 - Prob. 128PCh. 3 - Prob. 129PCh. 3 - Prob. 130PCh. 3 - Prob. 131PCh. 3 - Prob. 132PCh. 3 - Radiology Mobile displays have the potential to...Ch. 3 - Radiology Mobile displays have the potential to...Ch. 3 - Prob. 135PCh. 3 - Prob. 136PCh. 3 - Prob. 137PCh. 3 - Cardiovascular Disease The ankle-arm...Ch. 3 - Cardiovascular Disease The ankle-arm...Ch. 3 - Cardiovascular Disease The ankle-arm...Ch. 3 - Prob. 141PCh. 3 - Prob. 142PCh. 3 - Prob. 143PCh. 3 - Obstetrics, Health Promotion A study was performed...
Knowledge Booster


Learn more about
Need a deep-dive on the concept behind this application? Look no further. Learn more about this topic, statistics and related others by exploring similar questions and additional content below.Similar questions
- A marketing agency wants to determine whether different advertising platforms generate significantly different levels of customer engagement. The agency measures the average number of daily clicks on ads for three platforms: Social Media, Search Engines, and Email Campaigns. The agency collects data on daily clicks for each platform over a 10-day period and wants to test whether there is a statistically significant difference in the mean number of daily clicks among these platforms. Conduct ANOVA test. You can provide your answer by inserting a text box and the answer must include: also please provide a step by on getting the answers in excel Null hypothesis, Alternative hypothesis, Show answer (output table/summary table), and Conclusion based on the P value.arrow_forwardA company found that the daily sales revenue of its flagship product follows a normal distribution with a mean of $4500 and a standard deviation of $450. The company defines a "high-sales day" that is, any day with sales exceeding $4800. please provide a step by step on how to get the answers Q: What percentage of days can the company expect to have "high-sales days" or sales greater than $4800? Q: What is the sales revenue threshold for the bottom 10% of days? (please note that 10% refers to the probability/area under bell curve towards the lower tail of bell curve) Provide answers in the yellow cellsarrow_forwardBusiness Discussarrow_forward
- The following data represent total ventilation measured in liters of air per minute per square meter of body area for two independent (and randomly chosen) samples. Analyze these data using the appropriate non-parametric hypothesis testarrow_forwardeach column represents before & after measurements on the same individual. Analyze with the appropriate non-parametric hypothesis test for a paired design.arrow_forwardShould you be confident in applying your regression equation to estimate the heart rate of a python at 35°C? Why or why not?arrow_forward
arrow_back_ios
SEE MORE QUESTIONS
arrow_forward_ios
Recommended textbooks for you
 Glencoe Algebra 1, Student Edition, 9780079039897...AlgebraISBN:9780079039897Author:CarterPublisher:McGraw Hill
 Big Ideas Math A Bridge To Success Algebra 1: Stu...AlgebraISBN:9781680331141Author:HOUGHTON MIFFLIN HARCOURTPublisher:Houghton Mifflin Harcourt
 Holt Mcdougal Larson Pre-algebra: Student Edition...AlgebraISBN:9780547587776Author:HOLT MCDOUGALPublisher:HOLT MCDOUGAL
Glencoe Algebra 1, Student Edition, 9780079039897...
Algebra
ISBN:9780079039897
Author:Carter
Publisher:McGraw Hill
Big Ideas Math A Bridge To Success Algebra 1: Stu...
Algebra
ISBN:9781680331141
Author:HOUGHTON MIFFLIN HARCOURT
Publisher:Houghton Mifflin Harcourt
Holt Mcdougal Larson Pre-algebra: Student Edition...
Algebra
ISBN:9780547587776
Author:HOLT MCDOUGAL
Publisher:HOLT MCDOUGAL
Continuous Probability Distributions - Basic Introduction; Author: The Organic Chemistry Tutor;https://www.youtube.com/watch?v=QxqxdQ_g2uw;License: Standard YouTube License, CC-BY
Probability Density Function (p.d.f.) Finding k (Part 1) | ExamSolutions; Author: ExamSolutions;https://www.youtube.com/watch?v=RsuS2ehsTDM;License: Standard YouTube License, CC-BY
Find the value of k so that the Function is a Probability Density Function; Author: The Math Sorcerer;https://www.youtube.com/watch?v=QqoCZWrVnbA;License: Standard Youtube License