
Videos
In Problems 39-62, graph each function using the techniques of shifting, compressing, stretching, and/or reflecting. Stan with the graph of the basic function (for example, ) and show all stages. Be sure to show at least three key points. Find the domain and the range of each function.
To graph: The function , using the techniques of shifting, compressing, stretching, and/or reflecting. Start with the graph of the basic function (for example, ) and show all stages. Be sure to show at least three key points. Find the domain and the range of each function.
Answer to Problem 40AYU
Domain of the function is .
Range of the function is .
Explanation of Solution
Given:
Graph:
Now use the following steps to obtain the graph of .
Step 1: The function is the square function.
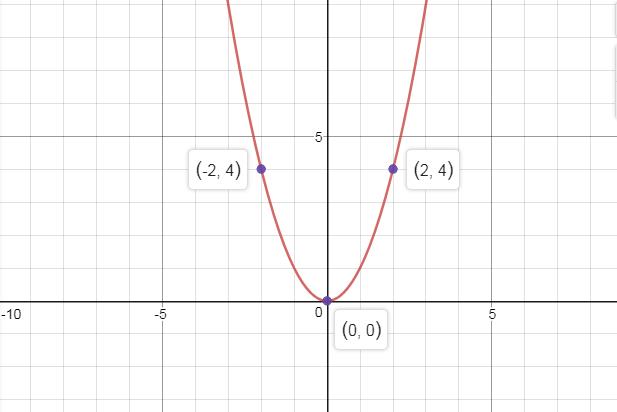
square function
Step 2: To obtain the graph of , add 4 from each on the graph of , that it is shifted up 4 units.
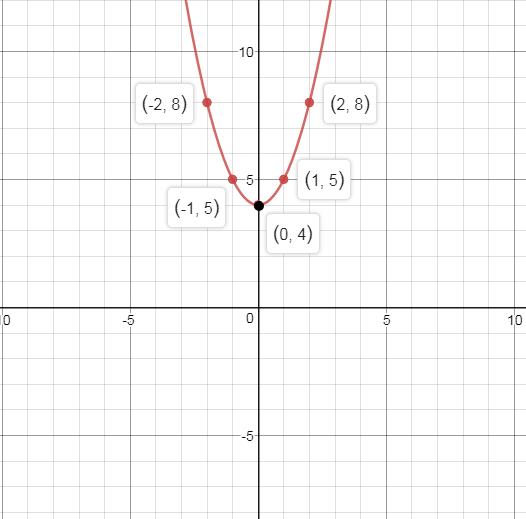
Add 4: vertical shift up 4 units
Interpretation:
Domain of the function is .
Range of the function is .
Chapter 2 Solutions
Precalculus Enhanced with Graphing Utilities
Additional Math Textbook Solutions
College Algebra with Modeling & Visualization (5th Edition)
Introductory Statistics
Algebra and Trigonometry (6th Edition)
Pre-Algebra Student Edition
Elementary Statistics (13th Edition)


- Given the following graph of the function y = f(x) and n = = 6, answer the following questions about the area under the curve from x graph to enlarge it.) 1 (Round your answer to within two decimal places if necessary, but do not round until your final computation.) a. Use the Trapezoidal Rule to estimate the area. Estimate: T6 G b. Use Simpson's Rule to estimate the area. Estimate: S6 - ID = 0 to x = 6. (Click on aarrow_forward"Solve the following differential equation using the Operator Method and the Determinant Method:" Solve by dr no ai """'+3y"" + 3y+y=arrow_forward(4,4) M -4 2 2 -4 (-4,-4) 4 8 10 12 (8,-4) (12,-4) Graph of f The figure shows the graph of a piecewise-linear function f. For −4≤x≤12, the function g is x defined by g(x) = √ƒ (t)dt . . Find the value of g(6). Find the value of g'(6). |arrow_forward
- PREVIOUS ANSWERS ASK YOUR TEACHER PRACTICE ANOTHER Find the derivative of the function. f'(x) = X x + √3x f(x) = 3x-5 (3√√3x+11√√x+5√3 2√√x (3x-5)² Need Help? Read It SUBMIT ANSWERarrow_forwardPREVIOUS ANSWERS ASK YOUR TEACHER PRACTICE A Find the derivative of the function and evaluate f'(x) at the given val f(x) = (√√√x + 3x) (x3/2 - x); x = 1 f'(x) = 9x 412 (12x (13) 2 - 4x-3√√√x f'(1) = 2 Need Help? Read It Watch It SUBMIT ANSWERarrow_forwardConsider the following functions. g(x) = x + √3x h(x) = 3x-5 x + √3x f(x) = = 3x-5 Find the derivative of each function. g'(x) h'(x) = = f'(x) = 3 = +1 2√3x 3 (3√3x + 10√√x +5√√√3 2√√x (3x-5)² Need Help? Read It SUBMIT ANSWERarrow_forward
- "Solve the following differential equation using the Operator Method and the Determinant Method:" y'''' + 3y'"' + 3y'' + y = xarrow_forwardpractice for exam please helparrow_forwardFig. 4.22. Problems 4.1 (A). Determine the second moments of area about the axes XX for the sections shown in Fig. 4.23. [15.69, 7.88, 41.15, 24; all x 10-6 m. All dimensions in mm IAA inn 100 25 50 25 50 80 50 50 Fig. 4.23. X 80 60arrow_forward
- 4.3 (A). A conveyor beam has the cross-section shown in Fig. 4.24 and it is subjected to a bending moment in the plane YY. Determine the maximum permissible bending moment which can be applied to the beam (a) for bottom flange in tension, and (b) for bottom flange in compression, if the safe stresses for the material in tension and compression are 30 MN/m² and 150 MN/m² respectively. Y [32.3, 84.8 kNm.] 150 100 50 -25 +50-50-50-50- All dimensions in mmarrow_forward"Find the values of V1, V2, and V3 by solving the following differential equation system:" 1 L1 1 X - X x 2 - 2x x2 x3 x² - 4x + 2] M Larrow_forward1. Consider the function f(x) whose graph is given below. Use the graph to determine the following: 2 a) All x for which f'(x) is positive. b) All x for which f'(x) is negative. 2 -2 c) The x for which f'(x) is zero. (please depict this on the graph)arrow_forward
 Calculus: Early TranscendentalsCalculusISBN:9781285741550Author:James StewartPublisher:Cengage Learning
 Thomas' Calculus (14th Edition)CalculusISBN:9780134438986Author:Joel R. Hass, Christopher E. Heil, Maurice D. WeirPublisher:PEARSON
 Calculus: Early Transcendentals (3rd Edition)CalculusISBN:9780134763644Author:William L. Briggs, Lyle Cochran, Bernard Gillett, Eric SchulzPublisher:PEARSON
 Calculus: Early TranscendentalsCalculusISBN:9781319050740Author:Jon Rogawski, Colin Adams, Robert FranzosaPublisher:W. H. Freeman
 Calculus: Early Transcendental FunctionsCalculusISBN:9781337552516Author:Ron Larson, Bruce H. EdwardsPublisher:Cengage Learning