
Concept explainers
Videos
In Problems 25-32, the graph of a function is given. Use the graph to find:
a. The intercepts, if any
b. The domain and range
c. The intervals on which the function is increasing, decreasing, or constant
d. Whether the function is even, odd, or neither
29.
To find: The following values using the given graph:
a. Intercepts ().
Answer to Problem 25AYU
From the graph, concluding the following results:
a. Intercepts ().
.
Explanation of Solution
Given:
It is asked to find the intercepts ( and if any), domain and range, increasing intervals, decreasing intervals, and constant intervals of the function using the graph. Also, check whether the function is even, odd or neither.
Graph:
Interpretation:
a. Intercepts (): The points, if any, at which a graph crosses or touches the coordinate axes are called the intercepts.
The of a point at which the graph crosses or touches the is an , and the of a point at which the graph crosses or touches the is an .
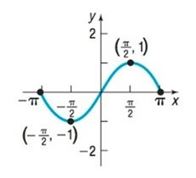
The intercepts of the graph are the points and .
The are and 0; the are and 0.
To find: The following values using the given graph:
b. The domain and range set of the function.
Answer to Problem 25AYU
From the graph, concluding the following results:
b. The domain and range set of the function.
The domain of is or the interval .
The range of is or the interval .
Explanation of Solution
Given:
It is asked to find the intercepts ( and if any), domain and range, increasing intervals, decreasing intervals, and constant intervals of the function using the graph. Also, check whether the function is even, odd or neither.
Graph:
Interpretation:
b. The domain and range set of the function.
To determine the domain of notice that the points on the graph of have between to , inclusive; and for each number between to , there is a point on the graph. The domain of is or the interval .
The points on the graph all have between and 1 inclusive; and for each such number , there is at least one number in the domain. The range of is or the interval .
To find: The following values using the given graph:
c. Increasing intervals, decreasing intervals and constant interval if any.
Answer to Problem 25AYU
From the graph, concluding the following results:
c. The function and the function is . There is no constant interval in the given graph.
Explanation of Solution
Given:
It is asked to find the intercepts ( and if any), domain and range, increasing intervals, decreasing intervals, and constant intervals of the function using the graph. Also, check whether the function is even, odd or neither.
Graph:
Interpretation:
c. Increasing intervals, decreasing intervals and constant interval if any.
It can be directly concluded from the graph that the curve is decreasing from to , then increasing from to , and at last decreasing from to .
Therefore, the function is increasing in the intervals and the function is decreasing in the intervals and . There is no constant interval in the given graph.
To find: The following values using the given graph:
d. Nature of the function (even, odd or neither).
Answer to Problem 25AYU
From the graph, concluding the following results:
d. The given function is symmetric with respect to the origin.
Explanation of Solution
Given:
It is asked to find the intercepts ( and if any), domain and range, increasing intervals, decreasing intervals, and constant intervals of the function using the graph. Also, check whether the function is even, odd or neither.
Graph:
Interpretation:
d. Nature of the function (even, odd or neither).
By the theorem of test for symmetry, “A function is even if and only if its graph is symmetric with respect to the . A function is odd if and only if its graph is symmetric with respect to the origin”.
A graph is symmetric with respect to the origin if for every point on the graph, there is also a point on the graph.
It can be easily concluded from the graph and the above statement that the given function is symmetric with respect to the origin.
Chapter 2 Solutions
Precalculus Enhanced with Graphing Utilities
Additional Math Textbook Solutions
Elementary Statistics (13th Edition)
Elementary Statistics
A First Course in Probability (10th Edition)
Introductory Statistics
Basic Business Statistics, Student Value Edition
A Problem Solving Approach To Mathematics For Elementary School Teachers (13th Edition)


- Calculus lll May I please have the blank lines completed, and final statement defined as a result? Thank you for the support!arrow_forward3. Consider the polynomial equation 6-iz+7z² - iz³ +z = 0 for which the roots are 3i, -2i, -i, and i. (a) Verify the relations between this roots and the coefficients of the polynomial. (b) Find the annulus region in which the roots lie.arrow_forwardForce with 800 N and 400 N are acting on a machine part at 30° and 60°, respectively with the positive x axisarrow_forward
- Find the accumulated amount A, if the principal P is invested at an interest rate of r per year for t years. (Round your answer to the nearest cent.) P = $13,000, r = 6%, t = 10, compounded quarterly A = $ 31902 Need Help? Read It Watch It Viewing Saved Work Revert to Last Response SUBMIT ANSWER O/6.66 Points] DETAILS MY NOTES TANAPCALC10 5.3.003. EVIOUS ANSWERS ASK YOUR TEACHER PRACTICE ANOTHER Find the accumulated amount A, if the principal P is invested at an interest rate of r per year for t years. (Round your answer to the nearest cent.) P = $140,000, r = 8%, t = 8, compounded monthly A = $259130.20 X Need Help? Read It Watch Itarrow_forwardFind the present value of $20,000 due in 3 years at the given rate of interest. (Round your answers to the nearest cent.) (a) 2%/year compounded monthly (b) 5%/year compounded daily $ Need Help? Read It Watch It SUBMIT ANSWER [-/6.66 Points] DETAILS MY NOTES TANAPCALC10 5.3.009. ASK YOUR TEACHER PRACTICE ANC Find the accumulated amount after 3 years if $4000 is invested at 3%/year compounded continuously. (Round your answer to the nearest cent.) Need Help? Read It Watch Itarrow_forwardFind the effective rate corresponding to the given nominal rate. (Round your answers to three decimal places.) (a) 9.5%/year compounded monthly % (b) 9.5%/year compounded daily % Need Help? Read It Watch It SUBMIT ANSWER -/6.66 Points] DETAILS MY NOTES TANAPCALC10 5.3.007. ASK YOUR TEACHE Find the present value of $90,000 due in 7 years at the given rate of interest. (Round your answers to the nearest cent.) (a) 9%/year compounded semiannually (b) 9%/year compounded quarterly LAarrow_forward
- Find the accumulated amount A, if the principal P is invested at an interest rate of r per year for t years. (Round your answer to the nearest cent.) P = $160,000, r = 7%, t = 4, compounded daily A = $211113.60 Need Help? Read It SUBMIT ANSWER ASK YOUR TEACHER PRACTICE ANOTHER --/6.66 Points] DETAILS MY NOTES TANAPCALC10 5.3.005. Find the effective rate corresponding to the given nominal rate. (Round your answers to three decimal places.) (a) 8%/year compounded semiannually % (b) 9%/year compounded quarterly %arrow_forwardFind the derivative of the function. g'(t) = 9t g(t) = In(t) (9ln(t) - 1) [In(t)] 2 × Need Help? Read It Watch Itarrow_forwardFind the accumulated amount A, if the principal P is invested at an interest rate of r per year for t years. (Round your answer to the nearest cent.) P = $3800, r = 4%, t = 10, compounded semiannually A = $ 5645.60 × Need Help? Read It SUBMIT ANSWER [3.33/6.66 Points] DETAILS MY NOTES REVIOUS ANSWERS ASK YOUR TEACHER TANAPCALC10 5.3.001.EP. PRACTICE ANOTHER Consider the following where the principal P is invested at an interest rate of r per year for t years. P = $3,100, r = 4%, t = 10, compounded semiannually Determine m, the number of conversion periods per year. 2 Find the accumulated amount A (in dollars). (Round your answer to the nearest cent.) A = $ 4604.44arrow_forward
- Force with 800 N and 400 N are acting on a machine part at 30° and 60°, respectively with a positive x axis, Draw the diagram representing this situationarrow_forwardI forgot to mention to you to solve question 1 and 2. Can you solve it using all data that given in the pict i given and can you teach me about that.arrow_forwardexam review please help!arrow_forward
 Calculus: Early TranscendentalsCalculusISBN:9781285741550Author:James StewartPublisher:Cengage Learning
 Thomas' Calculus (14th Edition)CalculusISBN:9780134438986Author:Joel R. Hass, Christopher E. Heil, Maurice D. WeirPublisher:PEARSON
 Calculus: Early Transcendentals (3rd Edition)CalculusISBN:9780134763644Author:William L. Briggs, Lyle Cochran, Bernard Gillett, Eric SchulzPublisher:PEARSON
 Calculus: Early TranscendentalsCalculusISBN:9781319050740Author:Jon Rogawski, Colin Adams, Robert FranzosaPublisher:W. H. Freeman
 Calculus: Early Transcendental FunctionsCalculusISBN:9781337552516Author:Ron Larson, Bruce H. EdwardsPublisher:Cengage Learning