
Concept explainers
Videos
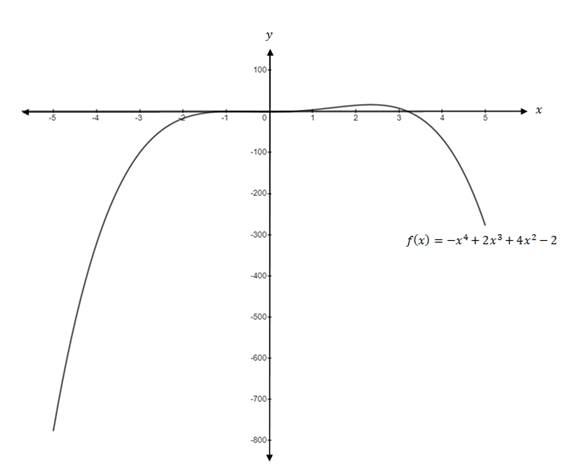
The function
Answer to Problem 6CT
Solution:
The graph of function

It has local maximum value
It has
It is increasing over the intervals
It is decreasing over the interval
Explanation of Solution
Given information:
The function is
To graph the function
Step I: Press the ON key.
Step II: Now, press [Y=]. Input the right hand side of the function
Step III: Press [WINDOW] key and set the viewing window as below:
Step IV: Then hit [Graph] key to view the graph.
The graph of the function is as follows:
To find local maximum and local minimum on graph using graphing utility, use below steps:
Step IV: Press [2ND][TRACE] to access the calculate menu.
Step V: Press [MAXIMUM] and press [ENTER].
Step VI: Set left bound by using left and right arrow. Click [ENTER].
Step VII: Set right bound by using left and right arrow. Click [ENTER].
Step VIII: Click [Enter] button twice.
It will give the maximum value
Round it to two decimals
Thus, the function has its local maximum value at
To find local minimum value, use below steps:
Step IX: Press [2ND][TRACE] to access the calculate menu.
Step X: Press [MINIMUM] and press [ENTER].
Step XI: Set left bound by using left and right arrow. Click [ENTER].
Step XII: Set right bound by using left and right arrow. Click [ENTER].
Step XIII: Click [Enter] button twice.
It will give the minimum value
Round it to two decimals
Thus, the function has its local minimum value at
By observing the graph of function
The function is decreasing over the interval
Chapter 2 Solutions
Precalculus Enhanced with Graphing Utilities
Additional Math Textbook Solutions
Introductory Statistics
Intro Stats, Books a la Carte Edition (5th Edition)
Pre-Algebra Student Edition
A First Course in Probability (10th Edition)
Elementary Statistics
College Algebra with Modeling & Visualization (5th Edition)


- There are three options for investing $1150. The first earns 10% compounded annually, the second earns 10% compounded quarterly, and the third earns 10% compounded continuously. Find equations that model each investment growth and use a graphing utility to graph each model in the same viewing window over a 20-year period. Use the graph to determine which investment yields the highest return after 20 years. What are the differences in earnings among the three investment? STEP 1: The formula for compound interest is A = nt = P(1 + − − ) n², where n is the number of compoundings per year, t is the number of years, r is the interest rate, P is the principal, and A is the amount (balance) after t years. For continuous compounding, the formula reduces to A = Pert Find r and n for each model, and use these values to write A in terms of t for each case. Annual Model r=0.10 A = Y(t) = 1150 (1.10)* n = 1 Quarterly Model r = 0.10 n = 4 A = Q(t) = 1150(1.025) 4t Continuous Model r=0.10 A = C(t) =…arrow_forwardUse a graphing utility to find the point of intersection, if any, of the graphs of the functions. Round your result to three decimal places. (Enter NONE in any unused answer blanks.) y = 100e0.01x (x, y) = y = 11,250 ×arrow_forward5. For the function y-x³-3x²-1, use derivatives to: (a) determine the intervals of increase and decrease. (b) determine the local (relative) maxima and minima. (e) determine the intervals of concavity. (d) determine the points of inflection. (e) sketch the graph with the above information indicated on the graph.arrow_forward
- Can you solve this 2 question numerical methodarrow_forward1. Estimate the area under the graph of f(x)-25-x from x=0 to x=5 using 5 approximating rectangles Using: (A) right endpoints. (B) left endpoints.arrow_forward9. Use fundamental theorem of calculus to find the derivative d a) *dt sin(x) b)(x)√1-2 dtarrow_forward
- 3. Evaluate the definite integral: a) √66x²+8dx b) x dx c) f*(2e* - 2)dx d) √√9-x² e) (2-5x)dx f) cos(x)dx 8)²₁₂√4-x2 h) f7dx i) f² 6xdx j) ²₂(4x+3)dxarrow_forward2. Consider the integral √(2x+1)dx (a) Find the Riemann sum for this integral using right endpoints and n-4. (b) Find the Riemann sum for this same integral, using left endpoints and n=4arrow_forwardProblem 11 (a) A tank is discharging water through an orifice at a depth of T meter below the surface of the water whose area is A m². The following are the values of a for the corresponding values of A: A 1.257 1.390 x 1.50 1.65 1.520 1.650 1.809 1.962 2.123 2.295 2.462|2.650 1.80 1.95 2.10 2.25 2.40 2.55 2.70 2.85 Using the formula -3.0 (0.018)T = dx. calculate T, the time in seconds for the level of the water to drop from 3.0 m to 1.5 m above the orifice. (b) The velocity of a train which starts from rest is given by the fol- lowing table, the time being reckoned in minutes from the start and the speed in km/hour: | † (minutes) |2|4 6 8 10 12 14 16 18 20 v (km/hr) 16 28.8 40 46.4 51.2 32.0 17.6 8 3.2 0 Estimate approximately the total distance ran in 20 minutes.arrow_forward
 Calculus: Early TranscendentalsCalculusISBN:9781285741550Author:James StewartPublisher:Cengage Learning
 Thomas' Calculus (14th Edition)CalculusISBN:9780134438986Author:Joel R. Hass, Christopher E. Heil, Maurice D. WeirPublisher:PEARSON
 Calculus: Early Transcendentals (3rd Edition)CalculusISBN:9780134763644Author:William L. Briggs, Lyle Cochran, Bernard Gillett, Eric SchulzPublisher:PEARSON
 Calculus: Early TranscendentalsCalculusISBN:9781319050740Author:Jon Rogawski, Colin Adams, Robert FranzosaPublisher:W. H. Freeman
 Calculus: Early Transcendental FunctionsCalculusISBN:9781337552516Author:Ron Larson, Bruce H. EdwardsPublisher:Cengage Learning