
Concept explainers
Videos
In Problems 49-56, for each graph of a function
, find the absolute maximum and the absolute minimum, if they exist. Identify any
55.
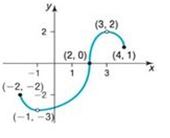
To find: The following values using the given graph:
a. Absolute maximum and minimum if they exist.
b. Local maximum and minimum values.
Answer to Problem 51AYU
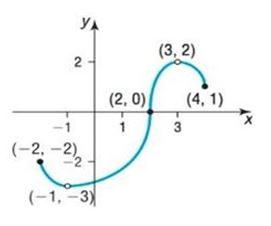
From the graph, the following results can be derived:
a. There is no absolute maximum and absolute minimum point for the given function.
b. There is no local maximum and local minimum points for the given function.
Explanation of Solution
Given:
It is asked to find the absolute maximum and minimum of the given function and also identify its local maximum and minimum values.
Graph:
Interpretation:
a. Absolute maximum: The absolute maximum can be found by selecting the largest value of from the following list:
- The values of at any local maxima of in .
- The value of at each endpoint of -that is, and .
It can be directly concluded from the graph and the definition that the curve has the point which is disconnected.
There is no local maximum point.
As the curve is disconnected there is no absolute maximum.
Absolute minimum: The absolute minimum can be found by selecting the smallest value of from the following list:
- The values of at any local minima of in .
- The value of at each endpoint of -that is, and .
It can be directly concluded from the graph and the definition that the curve has the point which is disconnected.
There is no local minimum point.
As the curve is disconnected there is no absolute minimum.
b. From the absolute maximum and absolute minimum values, identify the local extrema that there is no local extrema points.
Chapter 2 Solutions
Precalculus Enhanced with Graphing Utilities
Additional Math Textbook Solutions
A First Course in Probability (10th Edition)
Thinking Mathematically (6th Edition)
University Calculus: Early Transcendentals (4th Edition)
Elementary Statistics


- 4. Suppose that the population of a certain collection of rare Brazilian ants is given by P(t)=(t+100) In(t+2), Where t represents the time in days. Find and interpret the rates of change of the population on the third day and on the tenth day.arrow_forwardFind all values of x for f (x)=(x²-4) 4 where the tangent line is horizontal. 5. Find the slope of the tangent line to the graph of f(x)=-√8x+1 at x=1. Write the equation of the tangent line.arrow_forward3. Find the derivative of each function. Label with appropriate derivative notation showing both dependent and independent variables. f(t)=4t(2t⭑+4)³ a. f(t)=4t (2t+4)³ (Answer must be factored.) b. y= 3 1 (2x³-4) 6arrow_forward
- 4.3 The Chain Rule 1. {Algebra review} Let f(x)=2x²-5 x and g(x)=6x+2. Find f[g(−5)]. 2. {Algebra review} Write h(x)=√√8x-3 as the composite of two functions f(x) and g(x). (There may be more than one way to do this.)arrow_forward4.4 Derivatives of Exponential Functions 1. Find derivatives of the functions defined as follows. a. g(t)=-3.4e b. y=e√x c. f(x)=(4x³+2)e³* d. y=- x²arrow_forward4.5 Derivatives of Logarithmic Functions 1. Find the derivative of each function. a) y=ln (-3x) b) f(u)=nu c) 9(x)=x-1 lnxarrow_forward
- 3. If the total revenue received from the sale of x items is given by R(x)=30ln (2x+1), While the total cost to produce x items is C(x)=✗, find the following. a) The marginal revenue b) The profit function P(x) (Hint: P(x)=R(x)-C(x)} c) The marginal profit when x=20 d) Interpret the results of part c).arrow_forward2. The sales of a new personal computer (in thousands) are given by S(t)=100-90€-04: Where t represents time in years. Find and interpret the rate of change of sales at each time. a) After 1 year b) After 5 years c) What is happening to the rate of change of sales as time goes on? d) Does the rate of change of sales ever equal zero?arrow_forward2. Find the equation of the line tangent to the graph of f(x)=ln(x²+5) at the point (-1, In 6). Do not approximate numbers.arrow_forward
 Calculus: Early TranscendentalsCalculusISBN:9781285741550Author:James StewartPublisher:Cengage Learning
 Thomas' Calculus (14th Edition)CalculusISBN:9780134438986Author:Joel R. Hass, Christopher E. Heil, Maurice D. WeirPublisher:PEARSON
 Calculus: Early Transcendentals (3rd Edition)CalculusISBN:9780134763644Author:William L. Briggs, Lyle Cochran, Bernard Gillett, Eric SchulzPublisher:PEARSON
 Calculus: Early TranscendentalsCalculusISBN:9781319050740Author:Jon Rogawski, Colin Adams, Robert FranzosaPublisher:W. H. Freeman
 Calculus: Early Transcendental FunctionsCalculusISBN:9781337552516Author:Ron Larson, Bruce H. EdwardsPublisher:Cengage Learning