
Videos
In 20x5, Major Company initiated a full-scale, quality improvement program. At the end of the year, Jack Aldredge, the president, noted with some satisfaction that the defects per unit of product had dropped significantly compared to the prior year. He was also pleased that relationships with suppliers had improved and defective materials had declined. The new quality training program was also well accepted by employees. Of most interest to the president, however, was the impact of the quality improvements on profitability. To help assess the dollar impact of the quality improvements, the actual sales and the actual quality costs for 20x4 and 20x5 are as follows by quality category:
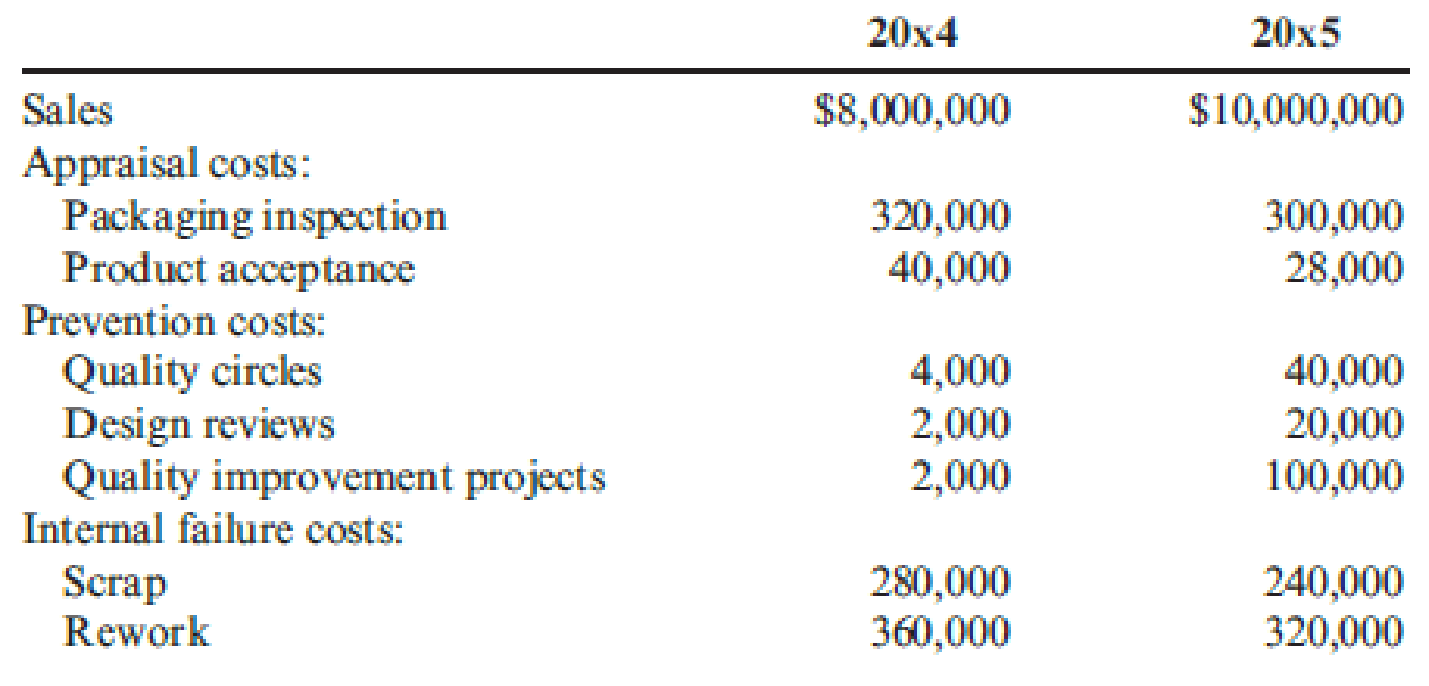
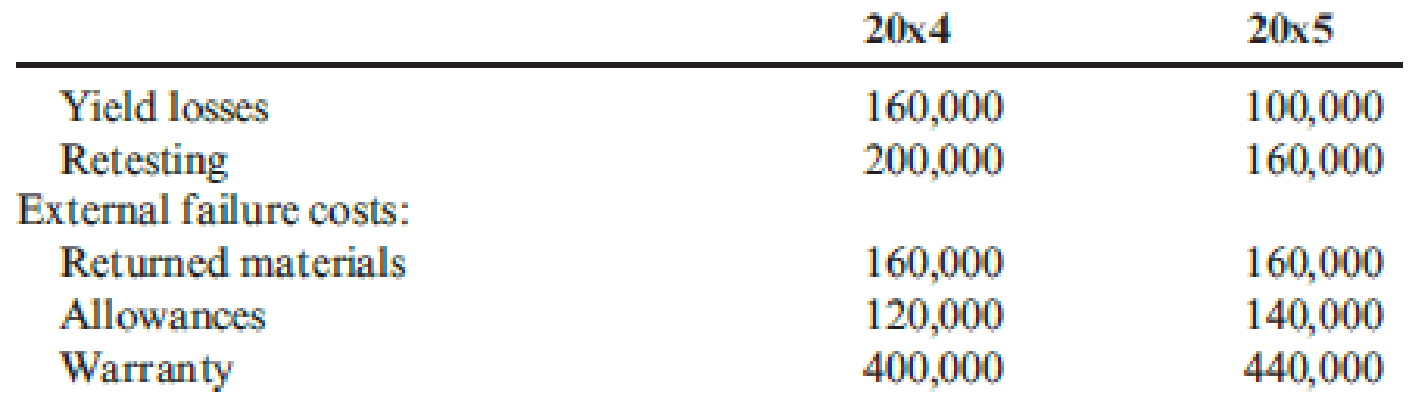
All prevention costs are fixed (by discretion). Assume all other quality costs are unit-level variable.
Required:
- 1. Compute the relative distribution of quality costs for each year and prepare a pie chart. Do you believe that the company is moving in the right direction in terms of the balance among the quality cost categories? Explain.
- 2. Prepare a one-year trend performance report for 20x5 (compare the actual costs of 20x5 with those of 20x4, adjusted for differences in sales volume). How much have profits increased because of the quality improvements made by Major Company?
- 3. Estimate the additional improvement in profits if Major Company ultimately reduces its quality costs to 2.5 percent of sales revenues (assume sales of $10 million).
1.
Calculate the relative distribution of quality costs for each year and prepare a pie chart and find out whether the company is moving in a right direction in terms of the balance among the quality cost management.
Explanation of Solution
Total Quality Management: Total Quality Management is a method that eliminates wasteful activities and improves quality throughout the value chain by allocating quality management responsibility, rewarding low-cost, high-quality results and monitoring quality costs.
Quality costs: Quality costs are costs that are incurred to avoid, identify and eliminate defects from products. Quality costs are classified into four components namely;
- 1. “Prevention costs”.
- 2. “Appraisal costs”.
- 3. “Internal failure costs”.
- 4. “External failure costs”.
Calculate the relative distribution of quality costs for the year 20x4:
Calculate the cost-to-sales ratio for appraisal cost:
Therefore, the cost-to-sales ratio for appraisal cost is 17.6%.
Calculate the cost-to-sales ratio for prevention cost:
Therefore, the cost-to-sales ratio for prevention cost is 0.4%.
Calculate the cost-to-sales ratio for internal failure cost:
Therefore, the cost-to-sales ratio for internal failure cost is 48.8%.
Calculate the cost-to-sales ratio for external failure cost:
Therefore, the cost-to-sales ratio for external failure cost is 33.2%.
Prepare pie chart for the year 20x4:
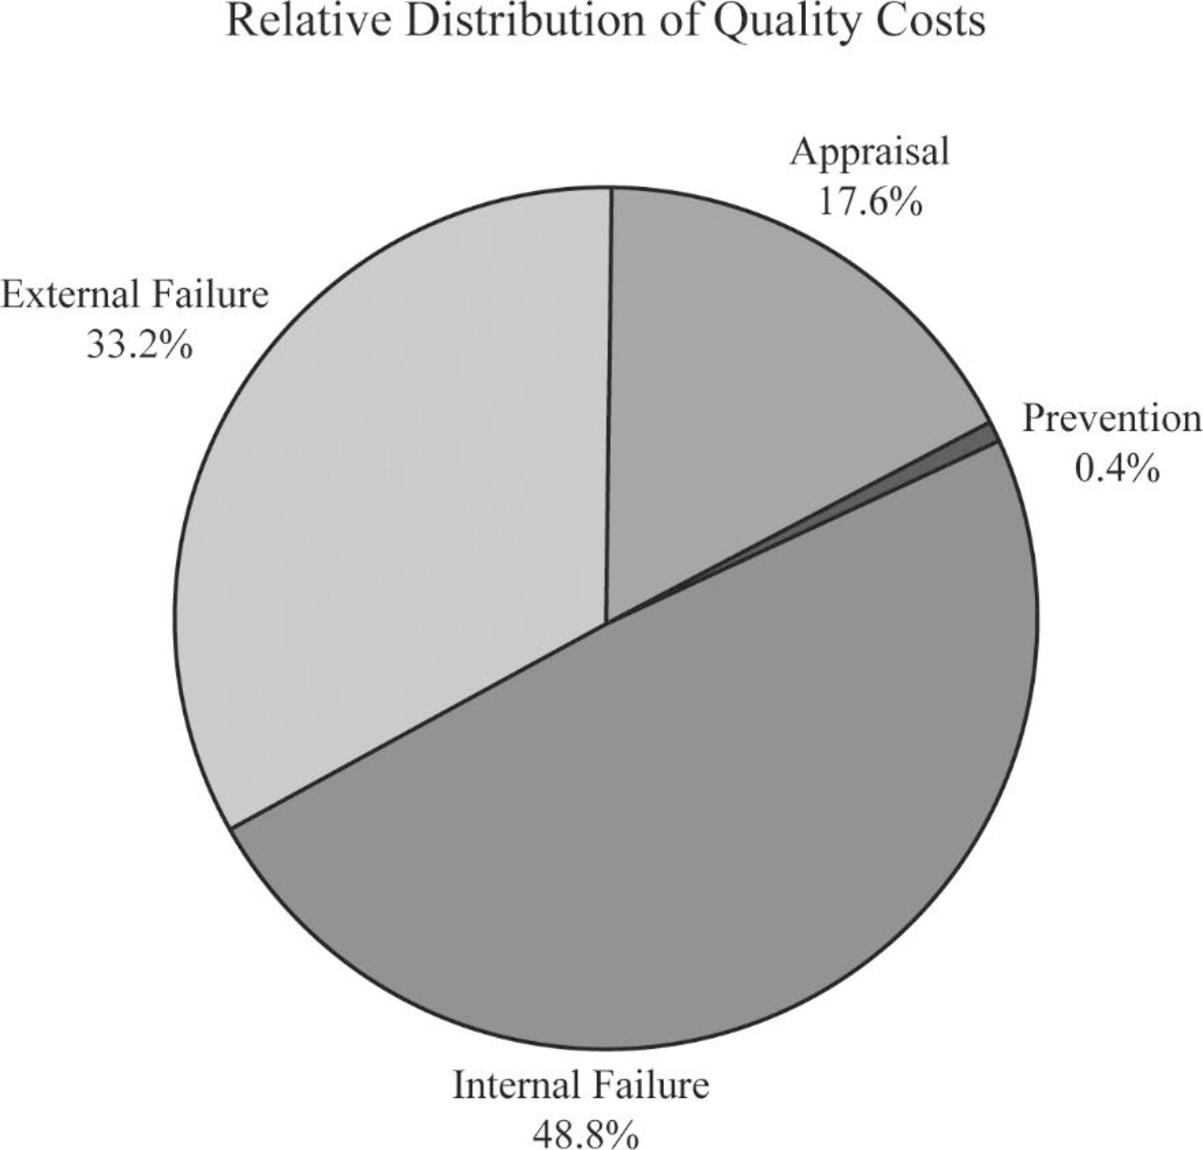
Figure (1)
Calculate the relative distribution of quality costs for 20x5:
Calculate the cost-to-sales ratio for appraisal cost:
Therefore, the cost-to-sales ratio for appraisal cost is 17.6%.
Calculate the cost-to-sales ratio for prevention cost:
Therefore, the cost-to-sales ratio for prevention cost is 0.4%.
Calculate the cost-to-sales ratio for internal failure cost:
Therefore, the cost-to-sales ratio for internal failure cost is 48.8%.
Calculate the cost-to-sales ratio for external failure cost:
Therefore, the cost-to-sales ratio for external failure cost is 33.2%.
Prepare pie chart for the year 20x5:
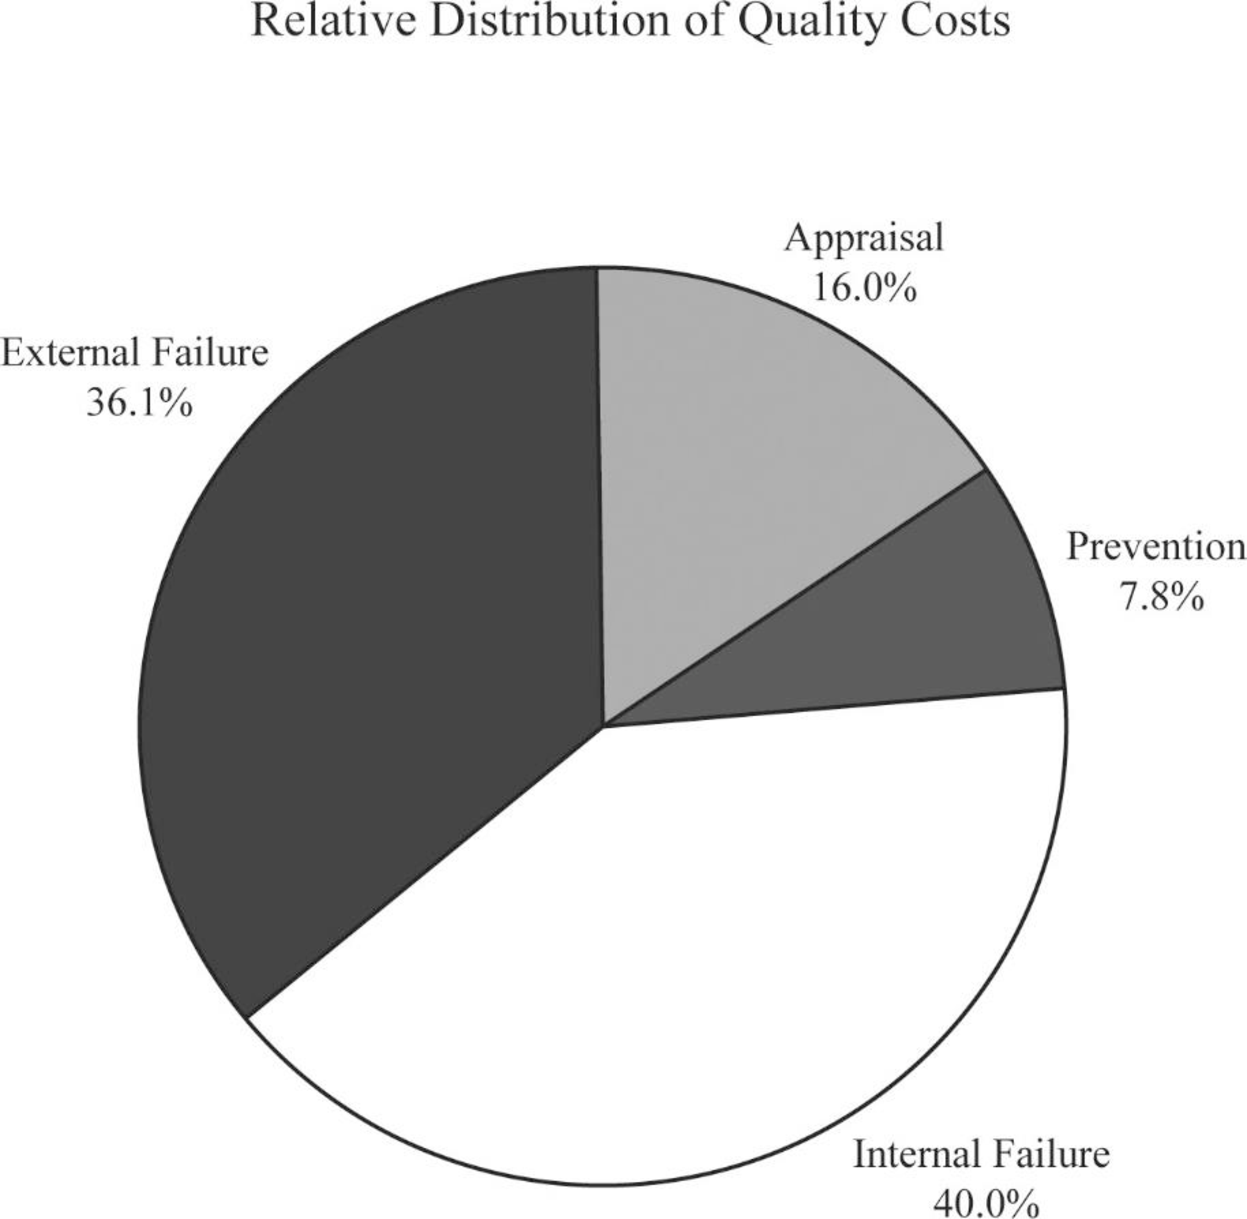
Figure (2)
Yes. Additional effort is required for “prevention and appraisal activities”. The movement is in that direction, and total failure costs is been decreased.
2.
Prepare a one-year performance report for 20x5 and find out the amount of profits increased sue the quality improvements made by Company M.
Explanation of Solution
Long-range performance report: Long-range performance report compares the “current actual” with the costs that will be allowed if the “zero-defects standard” is being met by assuming that sales level is equal to that of the existing period.
Prepare a one-year performance report for 20x5:
| Company M | ||||
| Performance Report | ||||
| One-Year Trend | ||||
| Particulars |
Actual Costs 20x5 (a) |
Actual Costs 20x4 (b) |
Variance | |
| Prevention costs | ||||
| Quality circles (F) | $40,000 | $4,000 | ($36,000) | U |
| Design reviews (F) | $20,000 | $2,000 | ($18,000) | U |
| Improvement projects (F) | $100,000 | $2,000 | ($98,000) | U |
| Total prevention costs | $160,000 | $8,000 | ($152,000) | U |
| Appraisal costs: | ||||
| Packaging inspection (V) | $300,000 | (1)$400,000 | $100,000 | F |
| Product acceptance (V) | $28,000 | (2)$50,000 | $22,000 | F |
| Total appraisal costs | $328,000 | $450,000 | $122,000 | F |
| Internal failure costs: | ||||
| Scrap (V) | $240,000 | (3)$350,000 | $110,000 | F |
| Rework (V) | $320,000 | (4)$450,000 | $130,000 | F |
| Yield losses (V) | $100,000 | (5)$200,000 | $100,000 | F |
| Retesting (V) | $160,000 | (6)$250,000 | $90,000 | F |
| Total internal failure costs | $820,000 | $1,250,000 | $430,000 | F |
| External failure costs: | ||||
| Returned materials (V) | $160,000 | (7)$200,000 | $40,000 | F |
| Allowances (V) | $140,000 | (8)$150,000 | $10,000 | F |
| Warranty (V) | $440,000 | (9)$500,000 | $60,000 | F |
| Total external failure costs | $740,000 | $850,000 | $110,000 | F |
| Total quality costs | $2,048,000 | $2,558,000 | $510,000 | F |
Table (1)
While comparing the costs of 20x5 with costs of 20x4, the costs for 20x4 should be adjusted to a sales level of $10 million. Therefore, all variable costs will vary from the 20x4 levels. For instance, the adjusted product packaging inspection cost is $400,000(1).
Working notes:
(1)Calculate the actual costs of packaging inspection:
(2)Calculate the actual costs of product acceptance:
(3)Calculate the actual costs of scrap:
(4)Calculate the actual costs of rework:
(5)Calculate the actual costs of yield losses:
(6)Calculate the actual costs of retesting:
(7)Calculate the actual costs of returned materials:
(8)Calculate the actual costs of returned allowances:
(9)Calculate the actual costs of returned warranty:
3.
Estimate the additional improvement in profits if Company M reduces its quality costs to 2.5 percent of sales revenue.
Explanation of Solution
Calculate the additional improvements in profits:
Therefore, the additional improvements in profits are $1,798,000.
Want to see more full solutions like this?
Chapter 14 Solutions
Cornerstones of Cost Management (Cornerstones Series)


- General Accounting questionarrow_forwardProvide answer general Accountingarrow_forwardCompare and contrast experiences you have had with your own and other people’s monochromic time orientation and polychronic time orientation and how you can account for any differences in time orientation in your workplace communications in the future.arrow_forward
- Your career is expanding with an opportunity to support your company's growth in a non-U.S. country. Choose a country that you believe is a viable expansion option. Support your choice for this country by learning about the country's political, economic, and legal system. Share this information with your classmates by summarizing how these areas would contribute to the successful expansion project.arrow_forwardPlease given correct answer general accountingarrow_forwardAnswer? ? Financial accounting questionarrow_forward
 Managerial Accounting: The Cornerstone of Busines...AccountingISBN:9781337115773Author:Maryanne M. Mowen, Don R. Hansen, Dan L. HeitgerPublisher:Cengage Learning
 Cornerstones of Cost Management (Cornerstones Ser...AccountingISBN:9781305970663Author:Don R. Hansen, Maryanne M. MowenPublisher:Cengage Learning