Cornerstones of Cost Management (Cornerstones Series)
4th Edition
ISBN: 9781305970663
Author: Don R. Hansen, Maryanne M. Mowen
Publisher: Cengage Learning
expand_more
expand_more
format_list_bulleted
Textbook Question
Chapter 14, Problem 1CE
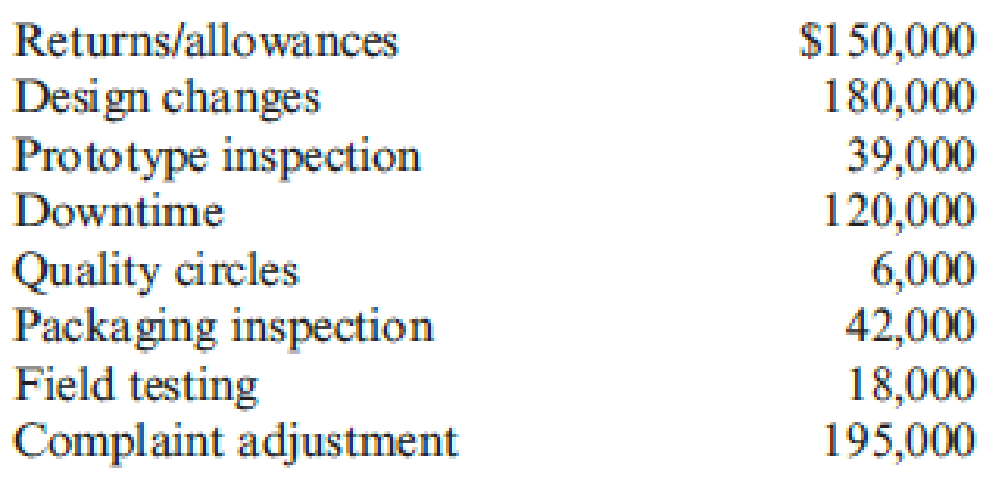
Evans Company had total sales of $3,000,000 for fiscal 20x5. The costs of quality-related activities are given below.
Required:
- 1. Prepare a quality cost report, classifying costs by category and expressing each category as a percentage of sales. What message does the cost report provide?
- 2. Prepare a bar graph and pie chart that illustrate each category’s contribution to total quality costs. Comment on the significance of the distribution.
- 3. What if, five years from now, quality costs are 7.5 percent of sales, with control costs being 65 percent of the total quality costs? What would your conclusion be?
Expert Solution & Answer
Trending nowThis is a popular solution!
Students have asked these similar questions
How Can I resolve this problem?
Walton Company has measured its quality costs for the past two years. After the company gathers its quality cost data, it summarizes those costs using the four categories shown below:
Required:
3. For this year, calculate the cost in each of the four categories as a percent of the total cost of quality.
4a. Calculate the change in total cost of quality over the two-year period.
Last Year
This Year
Prevention costs
$
339,200
$
637,000
Appraisal costs
$
467,300
$
496,000
Internal failure costs
$
853,200
$
545,000
External failure costs
$
1,001,000
$
734,400
Walton Company has measured its quality costs for the past two years. After the company gathers its quality cost data, it summarizes
those costs using the four categories shown below:
Prevention costs
Appraisal costs
Internal failure costs
External failure costs
Last Year
$ 353,400
$ 445,000
$ 766,300
$ 1,034,000
Required:
1. Calculate the total cost of quality last year and this year.
2. For last year, calculate the cost in each of the four categories as a percent of the total cost of quality.
3. For this year, calculate the cost in each of the four categories as a percent of the total cost of quality.
4-a. Calculate the change in total cost of quality over the two-year period.
4-b. Is performance trending in a favorable or unfavorable direction?
Required 1 Required 2
This Year
$ 611,000
$ 528,700
$ 550,000
$ 714,000
Complete this question by entering your answers in the tabs below.
Favorable
OUnfavorable
Required 3 Required 4A Required 4B
Is performance trending in a favorable or…
Armer Company is accumulating data to use in preparing its annual profit plan for the coming year.
The cost behavior pattern of the maintenance costs must be determined. The accounting staff has
suggested the use of linear regression to derive an equation for maintenance hours and costs.
Data regarding the maintenance hours and costs for the last year and the results of the regression
analysis follow:
Maintenance
Machine
Month
Cost
Hours
$ 4,200
Jan.
480
Feb.
3,000
320
Mar.
3,600
400
Apr.
2,820
300
May
4,350
500
June
2,960
310
July
3,030
320
Aug.
4,470
520
Sept.
4,260
490
Oct.
4,050
470
Nov.
3,300
350
Dec.
3,160
340
Sum
$43, 200
4,800
$ 3,600
$
$
$ 684.65
Average
400
Average cost per hour
a (intercept)
b (coefficient)
9.00
7.2884
Standard error of the estimate
34.469
R-squared
0.99724
t-value for b
60.105
At 400 hours of activity, Armer management can be approximately two-thirds confident that the
maintenance costs will be in the range of
Chapter 14 Solutions
Cornerstones of Cost Management (Cornerstones Series)
Ch. 14 - What is the difference between quality of design...Ch. 14 - Why are quality costs the costs of doing things...Ch. 14 - Prob. 3DQCh. 14 - Describe the Taguchi quality loss function, and...Ch. 14 - Identify and discuss the four kinds of quality...Ch. 14 - Explain why external failure costs can be more...Ch. 14 - Prob. 7DQCh. 14 - Prob. 8DQCh. 14 - Describe the three types of quality performance...Ch. 14 - Prob. 10DQ
Ch. 14 - If a firms annual sales are 200 million, what...Ch. 14 - Explain why it is important for a manager to...Ch. 14 - Prob. 13DQCh. 14 - Explain why the Accounting Department should be...Ch. 14 - Prob. 15DQCh. 14 - What is ecoefficiency?Ch. 14 - Prob. 17DQCh. 14 - Prob. 18DQCh. 14 - Prob. 19DQCh. 14 - What are the four categories of environmental...Ch. 14 - Prob. 21DQCh. 14 - What does full environmental costing mean? Full...Ch. 14 - What information is communicated by the unit...Ch. 14 - Evans Company had total sales of 3,000,000 for...Ch. 14 - Prob. 2CECh. 14 - Ross Company implemented a quality improvement...Ch. 14 - Nabors Company had actual quality costs for the...Ch. 14 - Verde Company reported operating costs of...Ch. 14 - Pinter Company had the following environmental...Ch. 14 - Rachel Boyce, president of a company that...Ch. 14 - Quality attributes such as performance and...Ch. 14 - Stahman, Inc., estimates its hidden external...Ch. 14 - Prob. 10ECh. 14 - Abernathy, Inc., produces two different generators...Ch. 14 - Kang Company reported sales of 3,240,000 in 20x5....Ch. 14 - Gagnon Company reported the following sales and...Ch. 14 - Muskogee Company had sales of 60,000,000 in 20x1....Ch. 14 - Javier Company has sales of 8 million and quality...Ch. 14 - In 20x4, Tru-Delite Frozen Desserts, Inc.,...Ch. 14 - Prob. 17ECh. 14 - Prob. 18ECh. 14 - Achieving sustainable development will likely...Ch. 14 - Classify the following environmental activities as...Ch. 14 - At the end of 20x5, Bing Pharmaceuticals began to...Ch. 14 - Prob. 22ECh. 14 - Coyle Pharmaceuticals produces two organic...Ch. 14 - Prob. 24ECh. 14 - Which of the following quality costs is an...Ch. 14 - Which of the following would be a hidden quality...Ch. 14 - Using the Taguchi quality loss function, an...Ch. 14 - Environmental costs are those costs incurred...Ch. 14 - Two products, Product A and Product B, are...Ch. 14 - Kathy Shorts, president of Oliver Company, was...Ch. 14 - Panguitch Company manufactures a component for...Ch. 14 - Gaston Company manufactures furniture. One of its...Ch. 14 - Classify the following quality costs as...Ch. 14 - Wayne Johnson, president of Banshee Company,...Ch. 14 - Recently, Ulrich Company received a report from an...Ch. 14 - In 20x5, Major Company initiated a full-scale,...Ch. 14 - Paper Products Division produces paper diapers,...Ch. 14 - In 2011, Milton Thayne, president of Carbondale...Ch. 14 - Iona Company, a large printing company, is in its...Ch. 14 - Prob. 40PCh. 14 - The following items are listed in an environmental...Ch. 14 - Refer to Problem 14.41. In the environmental...Ch. 14 - The following environmental cost reports for 20x3,...Ch. 14 - Refer to Problem 14.43. In 20x3, Jack Carter,...
Knowledge Booster
Learn more about
Need a deep-dive on the concept behind this application? Look no further. Learn more about this topic, accounting and related others by exploring similar questions and additional content below.Similar questions
- The controller of Emery, Inc. has computed quality costs as a percentage of sales for the past 5 years (20X1 was the first year the company implemented a quality improvement program). This information is as follows: Required: 1. Prepare a trend graph for total quality costs. Comment on what the graph has to say about the success of the quality improvement program. 2. Prepare a graph that shows the trend for each quality cost category. What does the graph have to say about the success of the quality improvement program? Does this graph supply more insight than the total cost trend graph does? 3. Prepare a graph that compares the trend in relative control costs versus relative failure costs. Comment on the significance of this trend.arrow_forwardPintura Company implemented a quality improvement program and tracked the following for the five years: By cost category as a percentage of sales for the same period of time: Required: 1. Prepare a bar graph that reveals the trend in quality cost as a percentage of sales (time on the horizontal axis and percentages on the vertical). Comment on the message of the graph. 2. Prepare a bar graph for each cost category as a percentage of sales. What does this graph tell you?arrow_forwardQuality Cost Report Loring Company had total sales of 2,400,000 for fiscal 20X1. The costs of quality-related activities are given below. Required: 1. Prepare a quality cost report, classifying costs by category and expressing each category as a percentage of sales. What message does the cost report provide? 2. Prepare a bar graph and pie chart that illustrate each categorys contribution to total quality costs. Comment on the significance of the distribution.arrow_forward
- Ross Company implemented a quality improvement program and tracked the following for the five years: By cost category as a percentage of sales for the same period of time: Required: 1. Prepare a bar graph that reveals the trend in quality cost as a percentage of sales (time on the horizontal axis and percentages on the vertical). Comment on the message of the graph. 2. Prepare a bar graph for each cost category as a percentage of sales. What does this graph tell you? 3. What if management would like to have the trend in relative distribution of quality costs? Express this as a bar graph and comment on its significance.arrow_forwardQuality Cost Report Whitley Company had total sales of 1,000,000 for the year ending 20X1. The costs of quality are given below. Required: 1. Prepare a quality cost report, classifying costs by category and expressing each category as a percentage of sales. What message does the cost report provide? 2. Prepare a bar graph and pie chart that illustrate each categorys contribution to total quality costs. Comment on the significance of the distribution.arrow_forwardBradshaw Company reported sales of 5,000,000 in 20X1. At the end of the fiscal year (June 30, 20X1), the following quality costs were reported: Required: 1. Prepare a quality cost report. 2. Prepare a graph (pie chart or bar graph) that shows the relative distribution of quality costs, and comment on the distribution. 3. Assuming sales of 5,000,000, by how much would profits increase if quality improves so that quality costs are only 3% of sales?arrow_forward
- Norris Company implemented a quality improvement program and tracked the following for the 5 years: By cost category of sales for the same period of time: Required: 1. Prepare a bar graph (hat reveals the trend in quality cost as a percentage of sales (time on horizontal axis and percentages on the vertical). Comment on the message of the graph. 2. Prepare a bar graph for each cost category as a percentage of sales. What does this graph tell you?arrow_forwardKang Company reported sales of 3,240,000 in 20x5. At the end of the calendar year, the following quality costs were reported: Required: 1. Prepare a quality cost report. 2. Prepare a graph (pie chart or bar graph) that shows the relative distribution of quality costs, and comment on the distribution.arrow_forwardNabors Company had actual quality costs for the year ended June 30, 20x5, as given below. At the zero-defect state, Nabors expects to spend 375,000 on quality engineering, 75,000 on vendor certification, and 50,000 on packaging inspection. Assume sales to be 25,000,000. Required: 1. Prepare a long-range performance report for 20x5. What does this report tell the management of Nabors? 2. Explain why quality costs still are present for the zero-defect state. 3. What if Nabors achieves the zero-defect state reflected in the report? What are some of the implications of this achievement?arrow_forward
- Walton Company has measured its quality costs for the past two years. After the company gathers its quality cost data, it summarizes those costs using the four categories shown below: Prevention costs Appraisal costs Internal failure costs Last Year $ 378,400 $ 440,600 This Year $ 591,500 $ 550,500 $ 813,700 $ 455,000 $ 1,144,000 $ 652,800 External failure costs Required: 1. Calculate the total cost of quality last year and this year. 2. For last year, calculate the cost in each of the four categories as a percent of the total cost of quality. 3. For this year, calculate the cost in each of the four categories as a percent of the total cost of quality. 4-a. Calculate the change in total cost of quality over the two-year period. 4-b. Is performance trending in a favorable or unfavorable direction? Complete this question by entering your answers in the tabs below. Required 1 Required 2 Required 3 Required 4A Required 4B Calculate the total cost of quality last year and this year. Total…arrow_forwardWalton Company has measured its quality costs for the past two years. After the company gathers its quality cost data, it summarizes those costs using the four categories shown below: This Year $ 357,000 $ 650,000 $ 445,000 $ 545,000 $ 790,000 $ 500,000 $1,100,000 $ 680,000 Last Year Prevention costs Appraisal costs Internal failure costs External failure costs Required: 1. Calculate the total cost of quality last year and this year. Last Year This Year Total cost of quality $ 2,692,000 $ 2,375,000 2. For last year, calculate the cost in each of the four categories as a percent of the total cost of quality. (Round your answers to 1 decimal place.) Last Year Prevention costs 13.3 % Appraisal costs 16.5 % Internal failure costs % 40.9 % 70.7 % External failure costs Total percentarrow_forwardQuality costs indices are often used to measure costs of quality relative to some financial measure, such as percent of sales. The following information on sales and quality costs were incurred in January 2024: Sales $510,000 Materials Inspection $43,500 Direct Materials Costs $70,000 Direct Labor Training $11,600 Direct Labor Costs $48,000 Batch Sampling Costs $7,800 Scrap and Rework Costs $16,400 Cost of Returns and Warranty $10,200 What is the quality of cost index? Answer in decimal format (i.e. O.XXX)arrow_forward
arrow_back_ios
SEE MORE QUESTIONS
arrow_forward_ios
Recommended textbooks for you
- Cornerstones of Cost Management (Cornerstones Ser...AccountingISBN:9781305970663Author:Don R. Hansen, Maryanne M. MowenPublisher:Cengage LearningManagerial Accounting: The Cornerstone of Busines...AccountingISBN:9781337115773Author:Maryanne M. Mowen, Don R. Hansen, Dan L. HeitgerPublisher:Cengage LearningExcel Applications for Accounting PrinciplesAccountingISBN:9781111581565Author:Gaylord N. SmithPublisher:Cengage Learning
- Principles of Cost AccountingAccountingISBN:9781305087408Author:Edward J. Vanderbeck, Maria R. MitchellPublisher:Cengage LearningPrinciples of Accounting Volume 2AccountingISBN:9781947172609Author:OpenStaxPublisher:OpenStax College
Cornerstones of Cost Management (Cornerstones Ser...
Accounting
ISBN:9781305970663
Author:Don R. Hansen, Maryanne M. Mowen
Publisher:Cengage Learning
Managerial Accounting: The Cornerstone of Busines...
Accounting
ISBN:9781337115773
Author:Maryanne M. Mowen, Don R. Hansen, Dan L. Heitger
Publisher:Cengage Learning
Excel Applications for Accounting Principles
Accounting
ISBN:9781111581565
Author:Gaylord N. Smith
Publisher:Cengage Learning
Principles of Cost Accounting
Accounting
ISBN:9781305087408
Author:Edward J. Vanderbeck, Maria R. Mitchell
Publisher:Cengage Learning
Principles of Accounting Volume 2
Accounting
ISBN:9781947172609
Author:OpenStax
Publisher:OpenStax College
Inspection and Quality control in Manufacturing. What is quality inspection?; Author: Educationleaves;https://www.youtube.com/watch?v=Ey4MqC7Kp7g;License: Standard youtube license