Cornerstones of Cost Management (Cornerstones Series)
4th Edition
ISBN: 9781305970663
Author: Don R. Hansen, Maryanne M. Mowen
Publisher: Cengage Learning
expand_more
expand_more
format_list_bulleted
Concept explainers
Textbook Question
Chapter 14, Problem 16E
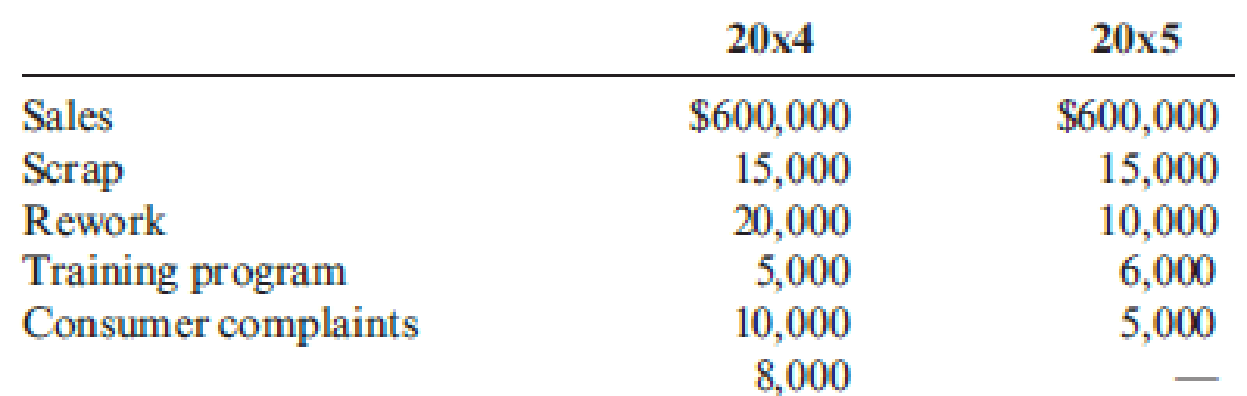
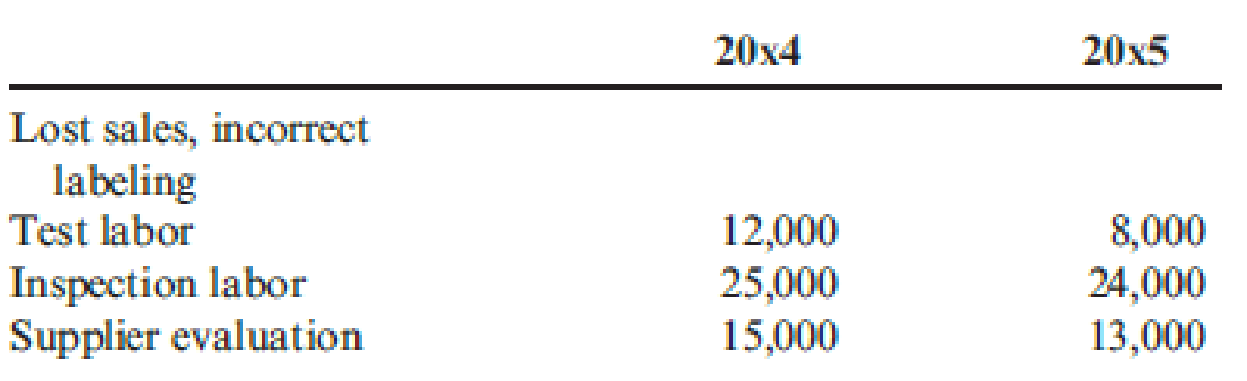
In 20x4, Tru-Delite Frozen Desserts, Inc., instituted a quality improvement program. At the end of 20x5, the management of the corporation requested a report to show the amount saved by the measures taken during the year. The actual sales and quality costs for 20x4 and 20x5 are as follows:
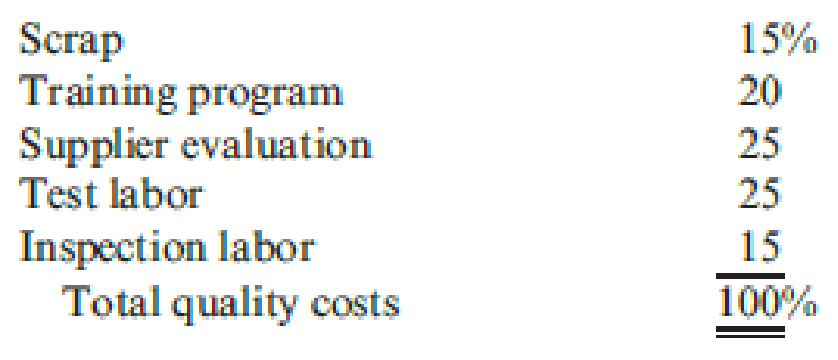
Tru-Delite’s management believes that quality costs can be reduced to 2.5 percent of sales within the next five years. At the end of 20x9, Tru-Delite’s sales are projected to grow to $750,000. The projected relative distribution of quality costs at the end of 20x9 is as follows:
Required:
- 1. Profits increased by what amount due to quality improvements made in 20x5?
- 2. Prepare a long-range performance report that compares the quality costs incurred at the end of 20x5 with the quality cost structure expected at the end of 20x9.
- 3. Are the targeted costs in the year 20x9 all value-added costs? How would you interpret the variances if the targeted costs are value-added costs?
- 4. What would be the profit increase in 20x9 if the 2.5 percent performance standard is met in that year?
Expert Solution & Answer
Trending nowThis is a popular solution!
Students have asked these similar questions
Lindell Manufacturing embarked on an ambitious quality program that is centered on continual improvement. This improvement is operationalized by declining quality costs from year toyear. Lindell rewards plant managers, production supervisors, and workers with bonuses ranging from $1,000 to $10,000 if their factory meets its annual quality cost goals.Len Smith, manager of Lindell’s Boise plant, felt obligated to do everything he could toprovide this increase to his employees. Accordingly, he has decided to take the following actionsduring the last quarter of the year to meet the plant’s budgeted quality cost targets:a. Decrease inspections of the process and final product by 50% and transfer inspectorstemporarily to quality training programs. Len believes this move will increase theinspectors’ awareness of the importance of quality; also, decreasing inspection willproduce significantly less downtime and less rework. By increasing the output anddecreasing the costs of internal failure,…
Each year, Sunshine Motos surveys 7,500 former and prospective customers regarding satisfaction and brand awareness. For the current year, the company is considering outsourcing the survey to Global Associates, who have offered to conduct the survey and summarize results for $30,000.Craig Sunshine, the president of Sunshine Motors, believes that Global will do a higher-quality job than his company has been doing, but is unwilling to spend more than $10,000 above the current costs. The head of bookkeeping for Sunshine has prepared the following summary of costs related to the survey in the prior year.
Mailing $16,000
Printing (done by Lester Print Shop) $4,500
Salary of Pat Fisher, part-time employee who stuffed envelopes and summarized data when surveys were returned (100 hours X $15) $1,500
Share of depreciation of computer and software used to track survey responses and summarized results. $1,100
Share…
The Backwoods American Company produces approximately 68,698 parkas annually. The quality-management program the company
implemented was able to improve the average percentage of good parkas produced by 1% each year, beginning with 89% good-quality
parkas in 2015. Only about 35% of poor-quality parkas could be reworked.
(a)
Compute the product yield for each of the five years. (Do not enter the percentages as decimals. Do not include the percent sign in your
answers. Round your answers to the nearest integer, e.g. 35.)
Year
2015
2016
2017
2018
2019
% Good-quality"
eTextbook and Media
Sove for Later
Product yield**
Attempts: unlimited Submit Answer
Chapter 14 Solutions
Cornerstones of Cost Management (Cornerstones Series)
Ch. 14 - What is the difference between quality of design...Ch. 14 - Why are quality costs the costs of doing things...Ch. 14 - Prob. 3DQCh. 14 - Describe the Taguchi quality loss function, and...Ch. 14 - Identify and discuss the four kinds of quality...Ch. 14 - Explain why external failure costs can be more...Ch. 14 - Prob. 7DQCh. 14 - Prob. 8DQCh. 14 - Describe the three types of quality performance...Ch. 14 - Prob. 10DQ
Ch. 14 - If a firms annual sales are 200 million, what...Ch. 14 - Explain why it is important for a manager to...Ch. 14 - Prob. 13DQCh. 14 - Explain why the Accounting Department should be...Ch. 14 - Prob. 15DQCh. 14 - What is ecoefficiency?Ch. 14 - Prob. 17DQCh. 14 - Prob. 18DQCh. 14 - Prob. 19DQCh. 14 - What are the four categories of environmental...Ch. 14 - Prob. 21DQCh. 14 - What does full environmental costing mean? Full...Ch. 14 - What information is communicated by the unit...Ch. 14 - Evans Company had total sales of 3,000,000 for...Ch. 14 - Prob. 2CECh. 14 - Ross Company implemented a quality improvement...Ch. 14 - Nabors Company had actual quality costs for the...Ch. 14 - Verde Company reported operating costs of...Ch. 14 - Pinter Company had the following environmental...Ch. 14 - Rachel Boyce, president of a company that...Ch. 14 - Quality attributes such as performance and...Ch. 14 - Stahman, Inc., estimates its hidden external...Ch. 14 - Prob. 10ECh. 14 - Abernathy, Inc., produces two different generators...Ch. 14 - Kang Company reported sales of 3,240,000 in 20x5....Ch. 14 - Gagnon Company reported the following sales and...Ch. 14 - Muskogee Company had sales of 60,000,000 in 20x1....Ch. 14 - Javier Company has sales of 8 million and quality...Ch. 14 - In 20x4, Tru-Delite Frozen Desserts, Inc.,...Ch. 14 - Prob. 17ECh. 14 - Prob. 18ECh. 14 - Achieving sustainable development will likely...Ch. 14 - Classify the following environmental activities as...Ch. 14 - At the end of 20x5, Bing Pharmaceuticals began to...Ch. 14 - Prob. 22ECh. 14 - Coyle Pharmaceuticals produces two organic...Ch. 14 - Prob. 24ECh. 14 - Which of the following quality costs is an...Ch. 14 - Which of the following would be a hidden quality...Ch. 14 - Using the Taguchi quality loss function, an...Ch. 14 - Environmental costs are those costs incurred...Ch. 14 - Two products, Product A and Product B, are...Ch. 14 - Kathy Shorts, president of Oliver Company, was...Ch. 14 - Panguitch Company manufactures a component for...Ch. 14 - Gaston Company manufactures furniture. One of its...Ch. 14 - Classify the following quality costs as...Ch. 14 - Wayne Johnson, president of Banshee Company,...Ch. 14 - Recently, Ulrich Company received a report from an...Ch. 14 - In 20x5, Major Company initiated a full-scale,...Ch. 14 - Paper Products Division produces paper diapers,...Ch. 14 - In 2011, Milton Thayne, president of Carbondale...Ch. 14 - Iona Company, a large printing company, is in its...Ch. 14 - Prob. 40PCh. 14 - The following items are listed in an environmental...Ch. 14 - Refer to Problem 14.41. In the environmental...Ch. 14 - The following environmental cost reports for 20x3,...Ch. 14 - Refer to Problem 14.43. In 20x3, Jack Carter,...
Knowledge Booster
Learn more about
Need a deep-dive on the concept behind this application? Look no further. Learn more about this topic, accounting and related others by exploring similar questions and additional content below.Similar questions
- Gagnon Company reported the following sales and quality costs for the past four years. Assume that all quality costs are variable and that all changes in the quality cost ratios are due to a quality improvement program. Required: 1. Compute the quality costs for all four years. By how much did net income increase from Year 1 to Year 2 because of quality improvements? From Year 2 to Year 3? From Year 3 to Year 4? 2. The management of Gagnon Company believes it is possible to reduce quality costs to 2.5 percent of sales. Assuming sales will continue at the Year 4 level, calculate the additional profit potential facing Gagnon. Is the expectation of improving quality and reducing costs to 2.5 percent of sales realistic? Explain. 3. Assume that Gagnon produces one type of product, which is sold on a bid basis. In Years 1 and 2, the average bid was 400. In Year 1, total variable costs were 250 per unit. In Year 3, competition forced the bid to drop to 380. Compute the total contribution margin in Year 3 assuming the same quality costs as in Year 1. Now, compute the total contribution margin in Year 3 using the actual quality costs for Year 3. What is the increase in profitability resulting from the quality improvements made from Year 1 to Year 3?arrow_forwardJavier Company has sales of 8 million and quality costs of 1,600,000. The company is embarking on a major quality improvement program. During the next three years, Javier intends to attack failure costs by increasing its appraisal and prevention costs. The right prevention activities will be selected, and appraisal costs will be reduced according to the results achieved. For the coming year, management is considering six specific activities: quality training, process control, product inspection, supplier evaluation, prototype testing, and redesign of two major products. To encourage managers to focus on reducing non-value-added quality costs and select the right activities, a bonus pool is established relating to reduction of quality costs. The bonus pool is equal to 10 percent of the total reduction in quality costs. Current quality costs and the costs of these six activities are given in the following table. Each activity is added sequentially so that its effect on the cost categories can be assessed. For example, after quality training is added, the control costs increase to 320,000, and the failure costs drop to 1,040,000. Even though the activities are presented sequentially, they are totally independent of each other. Thus, only beneficial activities need be selected. Required: 1. Identify the control activities that should be implemented, and calculate the total quality costs associated with this selection. Assume that an activity is selected only if it increases the bonus pool. 2. Given the activities selected in Requirement 1, calculate the following: a. The reduction in total quality costs b. The percentage distribution for control and failure costs c. The amount for this years bonus pool 3. Suppose that a quality engineer complained about the gainsharing incentive system. Basically, he argued that the bonus should be based only on reductions of failure and appraisal costs. In this way, investment in prevention activities would be encouraged, and eventually, failure and appraisal costs would be eliminated. After eliminating the non-value-added costs, focus could then be placed on the level of prevention costs. If this approach were adopted, what activities would be selected? Do you agree or disagree with this approach? Explain.arrow_forwardLuna Company is a printing company and a subsidiary of a large publishing company. Luna is in its fourth year of a 5-year, quality improvement program. The program began in 20X1 as a result of a report by a consulting firm that revealed that quality costs were about 20% of sales. Concerned about the level of quality costs, Lunas top management began a 5-year plan in 20X1 with the objective of lowering quality costs to 10% of sales by the end of 20X5. Sales and quality costs for each year are as follows: Quality costs by category are expressed as a percentage of sales as follows: The detail of the 20X5 budget for quality costs is also provided. Actual quality costs for 20X4 and 20X5 are as follows: Required: 1. Prepare an interim quality cost performance report for 20X5 that compares actual quality costs with budgeted quality costs. Comment on the firms ability to achieve its quality goals for the year. 2. Prepare a single-period quality performance report for 20X5 that compares the actual quality costs of 20X4 with the actual costs of 20X5. How much did profits change because of improved quality? 3. Prepare a graph that shows the trend in total quality costs as a percentage of sales since the inception of the quality improvement program. 4. Prepare a graph that shows the trend for all four quality cost categories for 20X1 through 20X5. How does this graph help management know that the reduction in total quality costs is attributable to quality improvements? 5. Assume that the company is preparing a second 5-year plan to reduce quality costs to 2.5% of sales. Prepare a long-range quality cost performance report that compares the costs for 20X5 with those planned for the end of the second 5-year period. Assume sales of 45 million at the end of 5 years. The final planned relative distribution of quality costs is as follows: proofreading, 50%; other inspection, 13%; quality training, 30%; and quality reporting, 7%. Assume that all prevention costs are fixed and all other costs are variable (with respect to sales).arrow_forward
- Evans Company had total sales of 3,000,000 for fiscal 20x5. The costs of quality-related activities are given below. Required: 1. Prepare a quality cost report, classifying costs by category and expressing each category as a percentage of sales. What message does the cost report provide? 2. Prepare a bar graph and pie chart that illustrate each categorys contribution to total quality costs. Comment on the significance of the distribution. 3. What if, five years from now, quality costs are 7.5 percent of sales, with control costs being 65 percent of the total quality costs? What would your conclusion be?arrow_forwardIn 20x5, Major Company initiated a full-scale, quality improvement program. At the end of the year, Jack Aldredge, the president, noted with some satisfaction that the defects per unit of product had dropped significantly compared to the prior year. He was also pleased that relationships with suppliers had improved and defective materials had declined. The new quality training program was also well accepted by employees. Of most interest to the president, however, was the impact of the quality improvements on profitability. To help assess the dollar impact of the quality improvements, the actual sales and the actual quality costs for 20x4 and 20x5 are as follows by quality category: All prevention costs are fixed (by discretion). Assume all other quality costs are unit-level variable. Required: 1. Compute the relative distribution of quality costs for each year and prepare a pie chart. Do you believe that the company is moving in the right direction in terms of the balance among the quality cost categories? Explain. 2. Prepare a one-year trend performance report for 20x5 (compare the actual costs of 20x5 with those of 20x4, adjusted for differences in sales volume). How much have profits increased because of the quality improvements made by Major Company? 3. Estimate the additional improvement in profits if Major Company ultimately reduces its quality costs to 2.5 percent of sales revenues (assume sales of 10 million).arrow_forwardMuskogee Company had sales of 60,000,000 in 20x1. In 20x5, sales had increased to 75,000,000. A quality improvement program was implemented at the beginning of 20x1. Overall conformance quality was targeted for improvement. The quality costs for 20x1 and 20x5 follow. Assume any changes in quality costs are attributable to improvements in quality. Required: 1. Compute the quality cost-to-sales ratio for each year. Is this type of improvement possible? 2. Calculate the relative distribution of costs by category for 20x1. What do you think of the way costs are distributed? (A pie chart or bar graph may be of some help.) How do you think they will be distributed as the company approaches a zero-defects state? 3. Calculate the relative distribution of costs by category for 20x5. What do you think of the level and distribution of quality costs? (A pie chart or bar graph may be of some help.) Do you think further reductions are possible? 4. The quality manager for Muskogee indicated that the external failure costs reported are only the measured costs. He argued that the 20x5 external costs were much higher than those reported and that additional investment ought to be made in control costs. Discuss the validity of his viewpoint. 5. Suppose that the manager of Muskogee received a bonus equal to 10 percent of the quality cost savings each year. Do you think that gainsharing is a good or a bad idea? Discuss the risks of gainsharing.arrow_forward
- Lindell Manufacturing embarked on an ambitious quality program that is centered on continual improvement. This improvement is operationalized by declining quality costs from year to year. Lindell rewards plant managers, production supervisors, and workers with bonuses ranging from 1,000 to 10,000 if their factory meets its annual quality cost goals. Len Smith, manager of Lindells Boise plant, felt obligated to do everything he could to provide this increase to his employees. Accordingly, he has decided to take the following actions during the last quarter of the year to meet the plants budgeted quality cost targets: a. Decrease inspections of the process and final product by 50% and transfer inspectors temporarily to quality training programs. Len believes this move will increase the inspectors awareness of the importance of quality; also, decreasing inspection will produce significantly less downtime and less rework. By increasing the output and decreasing the costs of internal failure, the plant can meet the budgeted reductions for internal failure costs. Also, by showing an increase in the costs of quality training, the budgeted level for prevention costs can be met. b. Delay replacing and repairing defective products until the beginning of the following year. While this may increase customer dissatisfaction somewhat, Len believes that most customers expect some inconvenience. Besides, the policy of promptly dealing with customers who are dissatisfied could be reinstated in 3 months. In the meantime, the action would significantly reduce the costs of external failure, allowing the plant to meet its budgeted target. c. Cancel scheduled worker visits to customers plants. This program, which has been very well received by customers, enables Lindell workers to see just how the machinery they make is used by the customer and also gives them first-hand information on any remaining problems with the machinery. Workers who went on previous customer site visits came back enthusiastic and committed to Lindells quality program. Lindells quality program staff believes that these visits will reduce defects during the following year. Required: 1. Evaluate Lens ethical behavior. In this evaluation, consider his concern for his employees. Was he justified in taking the actions described? If not, what should he have done? 2. Assume that the company views Lens behavior as undesirable. What can the company do to discourage it? 3. Assume that Len is a CMA and a member of the IMA. Refer to the ethical code for management accountants in Chapter 1. Were any of these ethical standards violated?arrow_forwardRecently, Ulrich Company received a report from an external consulting group on its quality costs. The consultants reported that the companys quality costs total about 21 percent of its sales revenues. Somewhat shocked by the magnitude of the costs, Rob Rustin, president of Ulrich Company, decided to launch a major quality improvement program. For the coming year, management decided to reduce quality costs to 17 percent of sales revenues. Although the amount of reduction was ambitious, most company officials believed that the goal could be realized. To improve the monitoring of the quality improvement program, Rob directed Pamela Golding, the controller, to prepare monthly performance reports comparing budgeted and actual quality costs. Budgeted costs and sales for the first two months of the year are as follows: The following actual sales and actual quality costs were reported for January: Required: 1. Reorganize the monthly budgets so that quality costs are grouped in one of four categories: appraisal, prevention, internal failure, or external failure. (Essentially, prepare a budgeted cost of quality report.) Also, identify each cost as variable (V) or fixed (F). (Assume that no costs are mixed.) 2. Prepare a performance report for January that compares actual costs with budgeted costs. Comment on the companys progress in improving quality and reducing its quality costs.arrow_forwardIn 2011, Milton Thayne, president of Carbondale Electronics, received a report indicating that quality costs were 31 percent of sales. Faced with increasing pressures from imported goods, Milton resolved to take measures to improve the overall quality of the companys products. After hiring a consultant in 20x0, the company began an aggressive program of total quality control. At the end of 20x5, Milton requested an analysis of the progress the company had made in reducing and controlling quality costs. The Accounting Department assembled the following data: Required: 1. Compute the quality costs as a percentage of sales by category and in total for each year. 2. Prepare a multiple-year trend graph for quality costs, both by total costs and by category. Using the graph, assess the progress made in reducing and controlling quality costs. Does the graph provide evidence that quality has improved? Explain. 3. Using the 20x1 quality cost relationships (assume all costs are variable), calculate the quality costs that would have prevailed in 20x4. By how much did profits increase in 20x4 because of the quality improvement program? Repeat for 20x5.arrow_forward
- The controller of Emery, Inc. has computed quality costs as a percentage of sales for the past 5 years (20X1 was the first year the company implemented a quality improvement program). This information is as follows: Required: 1. Prepare a trend graph for total quality costs. Comment on what the graph has to say about the success of the quality improvement program. 2. Prepare a graph that shows the trend for each quality cost category. What does the graph have to say about the success of the quality improvement program? Does this graph supply more insight than the total cost trend graph does? 3. Prepare a graph that compares the trend in relative control costs versus relative failure costs. Comment on the significance of this trend.arrow_forwardBienestar, Inc., has two plants that manufacture a line of wheelchairs. One is located in Kansas City, and the other in Tulsa. Each plant is set up as a profit center. During the past year, both plants sold their tilt wheelchair model for 1,620. Sales volume averages 20,000 units per year in each plant. Recently, the Kansas City plant reduced the price of the tilt model to 1,440. Discussion with the Kansas City manager revealed that the price reduction was possible because the plant had reduced its manufacturing and selling costs by reducing what was called non-value-added costs. The Kansas City manufacturing and selling costs for the tilt model were 1,260 per unit. The Kansas City manager offered to loan the Tulsa plant his cost accounting manager to help it achieve similar results. The Tulsa plant manager readily agreed, knowing that his plant must keep pacenot only with the Kansas City plant but also with competitors. A local competitor had also reduced its price on a similar model, and Tulsas marketing manager had indicated that the price must be matched or sales would drop dramatically. In fact, the marketing manager suggested that if the price were dropped to 1,404 by the end of the year, the plant could expand its share of the market by 20 percent. The plant manager agreed but insisted that the current profit per unit must be maintained. He also wants to know if the plant can at least match the 1,260 per-unit cost of the Kansas City plant and if the plant can achieve the cost reduction using the approach of the Kansas City plant. The plant controller and the Kansas City cost accounting manager have assembled the following data for the most recent year. The actual cost of inputs, their value-added (ideal) quantity levels, and the actual quantity levels are provided (for production of 20,000 units). Assume there is no difference between actual prices of activity units and standard prices. Required: 1. Calculate the target cost for expanding the Tulsa plants market share by 20 percent, assuming that the per-unit profitability is maintained as requested by the plant manager. 2. Calculate the non-value-added cost per unit. Assuming that non-value-added costs can be reduced to zero, can the Tulsa plant match the Kansas City per-unit cost? Can the target cost for expanding market share be achieved? What actions would you take if you were the plant manager? 3. Describe the role that benchmarking played in the effort of the Tulsa plant to protect and improve its competitive position.arrow_forwardIn 20X1, Don Blackburn, president of Price Electronics, received a report indicating that quality costs were 31% of sales. Faced with increasing pressures from imported goods. Don resolved to take measures to improve the overall quality of the companys products. After hiring a consultant in 20X1, the company began an aggressive program of total quality control. At the end of 20X5, Don requested an analysis of the progress the company had made in reducing and controlling quality costs. The accounting department assembled the following data: Required: 1. Compute the quality costs as a percentage of sales by category and in total for each year. 2. Prepare a multiple-year trend graph for quality costs, both by total costs and by category. Using the graph, assess the progress made in reducing and controlling quality costs. Does the graph provide evidence that quality has improved? Explain. 3. Using the 20X1 quality cost relationships (assume all costs are variable), calculate the quality costs that would have prevailed in 20X4. By how much did profits increase in 20X4 because of the quality improvement program? Repeat for 20X5.arrow_forward
arrow_back_ios
SEE MORE QUESTIONS
arrow_forward_ios
Recommended textbooks for you
- Cornerstones of Cost Management (Cornerstones Ser...AccountingISBN:9781305970663Author:Don R. Hansen, Maryanne M. MowenPublisher:Cengage LearningManagerial Accounting: The Cornerstone of Busines...AccountingISBN:9781337115773Author:Maryanne M. Mowen, Don R. Hansen, Dan L. HeitgerPublisher:Cengage Learning
Cornerstones of Cost Management (Cornerstones Ser...
Accounting
ISBN:9781305970663
Author:Don R. Hansen, Maryanne M. Mowen
Publisher:Cengage Learning
Managerial Accounting: The Cornerstone of Busines...
Accounting
ISBN:9781337115773
Author:Maryanne M. Mowen, Don R. Hansen, Dan L. Heitger
Publisher:Cengage Learning
Cost-Volume-Profit (CVP) Analysis and Break-Even Analysis Step-by-Step, by Mike Werner; Author: Accounting Step by Step;https://www.youtube.com/watch?v=D0MOfse9OWk;License: Standard Youtube License