
Organic Chemistry
12th Edition
ISBN: 9781118875766
Author: T. W. Graham Solomons, Craig B. Fryhle, Scott A. Snyder
Publisher: WILEY
expand_more
expand_more
format_list_bulleted
Concept explainers
Videos
Textbook Question
Chapter 12, Problem 4PP
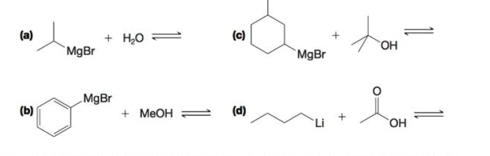
PRACTICE PROBLEM 12.4
Predict the products of the following acid–base reactions. Using
Expert Solution & Answer
Want to see the full answer?
Check out a sample textbook solution
Students have asked these similar questions
Draw the formula of the product obtained by reacting adipic acid 1st with PCl5 and 2nd treatment with NH3.
please help me with my homework
help
Chapter 12 Solutions
Organic Chemistry
Ch. 12 - Prob. 1PPCh. 12 - Prob. 2PPCh. 12 - Prob. 3PPCh. 12 - PRACTICE PROBLEM 12.4 Predict the products of the...Ch. 12 - Prob. 5PPCh. 12 - Prob. 6PPCh. 12 - Practice Problem 12.7
Provide retrosynthetic...Ch. 12 - Prob. 8PPCh. 12 - What products would you expect from the reaction...Ch. 12 - What products would you expect from the reaction...
Ch. 12 - What product (or products) would be formed from...Ch. 12 - Prob. 12PCh. 12 - 12.13 Write reaction conditions and the product...Ch. 12 - Prob. 14PCh. 12 - Predict the organic product from each of the...Ch. 12 - Predict the organic product from each of the...Ch. 12 - Predict the organic product from each of the...Ch. 12 - Predict the major organic product from each of the...Ch. 12 - Synthesize each of the following compounds from...Ch. 12 - Prob. 20PCh. 12 - 21. Write a mechanism for the following reaction....Ch. 12 - Prob. 22PCh. 12 - 23. What organic products A-H would you expect...Ch. 12 - Prob. 24PCh. 12 - Show how 1-pentanol could be transformed into each...Ch. 12 - Provide the reagents needed to accomplish...Ch. 12 - Prob. 27PCh. 12 - For each of the following alcohols, write a...Ch. 12 - Prob. 29PCh. 12 - Prob. 30PCh. 12 - Prob. 31PCh. 12 - Prob. 32PCh. 12 - Predict the major organic product from each of the...Ch. 12 - 34. Synthesize the following compound using...Ch. 12 - Prob. 35PCh. 12 - Prob. 36PCh. 12 - 37. Explain how and IR spectroscopy could be used...Ch. 12 - 38. An unknown X shows a broad absorption band in...Ch. 12 - Prob. 39PCh. 12 - The problem below is directed toward devising a...
Additional Science Textbook Solutions
Find more solutions based on key concepts
A particle moves along a straight path through displacement d= 8 m i cj while force F= 2 N i 4 N j acts on it...
Fundamentals of Physics Extended
Two culture media were inoculated with four different bacteria. After incubation, the following results were ob...
Microbiology: An Introduction
1.3 Obtain a bottle of multivitamins and read the list of ingredients. What are four chemicals from the list?
Chemistry: An Introduction to General, Organic, and Biological Chemistry (13th Edition)
41. A reaction in which A, B, and C react to form products is first order in A, second order in B, and zero ord...
Chemistry: Structure and Properties (2nd Edition)
Choose the best answer to each of the following. Explain your reasoning. Based on current data, planetary syste...
Cosmic Perspective Fundamentals
What two body structures contain flexible elastic cartilage?
Anatomy & Physiology (6th Edition)
Knowledge Booster


Learn more about
Need a deep-dive on the concept behind this application? Look no further. Learn more about this topic, chemistry and related others by exploring similar questions and additional content below.Similar questions
- The temperature on a sample of pure X held at 1.25 atm and -54. °C is increased until the sample boils. The temperature is then held constant and the pressure is decreased by 0.42 atm. On the phase diagram below draw a path that shows this set of changes. pressure (atm) 2 0 0 200 400 temperature (K) Xarrow_forwardQUESTION: Answer Question 5: 'Calculating standard error of regression' STEP 1 by filling in all the empty green boxes *The values are all provided in the photo attached*arrow_forwardpressure (atm) 3 The pressure on a sample of pure X held at 47. °C and 0.88 atm is increased until the sample condenses. The pressure is then held constant and the temperature is decreased by 82. °C. On the phase diagram below draw a path that shows this set of changes. 0 0 200 temperature (K) 400 аarrow_forward
- er your payment details | bar xb Home | bartleby x + aleksogi/x/isl.exe/1o u-lgNskr7j8P3jH-1Qs_pBanHhviTCeeBZbufuBYT0Hz7m7D3ZcW81NC1d8Kzb4srFik1OUFhKMUXzhGpw7k1 O States of Matter Sketching a described thermodynamic change on a phase diagram 0/5 The pressure on a sample of pure X held at 47. °C and 0.88 atm is increased until the sample condenses. The pressure is then held constant and the temperature is decreased by 82. °C. On the phase diagram below draw a path that shows this set of changes. pressure (atm) 1 3- 0- 0 200 Explanation Check temperature (K) 400 X Q Search L G 2025 McGraw Hill LLC. All Rights Reserved Terms of Use Privacy Cearrow_forward5.arrow_forward6.arrow_forward
- 0/5 alekscgi/x/sl.exe/1o_u-IgNglkr7j8P3jH-IQs_pBaHhvlTCeeBZbufuBYTi0Hz7m7D3ZcSLEFovsXaorzoFtUs | AbtAURtkqzol 1HRAS286, O States of Matter Sketching a described thermodynamic change on a phase diagram The pressure on a sample of pure X held at 47. °C and 0.88 atm is increased until the sample condenses. The pressure is then held constant and the temperature is decreased by 82. °C. On the phase diagram below draw a path that shows this set of changes. 3 pressure (atm) + 0- 0 5+ 200 temperature (K) 400 Explanation Check X 0+ F3 F4 F5 F6 F7 S 2025 McGraw Hill LLC All Rights Reserved. Terms of Use Privacy Center Accessibility Q Search LUCR + F8 F9 F10 F11 F12 * % & ( 5 6 7 8 9 Y'S Dele Insert PrtSc + Backsarrow_forward5.arrow_forward9arrow_forward
- alekscgi/x/lsl.exe/1o_u-IgNslkr7j8P3jH-IQs_pBanHhvlTCeeBZbufu BYTI0Hz7m7D3ZS18w-nDB10538ZsAtmorZoFusYj2Xu9b78gZo- O States of Matter Sketching a described thermodynamic change on a phase diagram 0/5 The pressure on a sample of pure X held at 47. °C and 0.88 atm is increased until the sample condenses. The pressure is then held constant and the temperature is decreased by 82. °C. On the phase diagram below draw a path that shows this set of changes. pressure (atm) 3- 200 temperature (K) Explanation Chick Q Sowncharrow_forward0+ aleksog/x/lsl.exe/1ou-lgNgkr7j8P3H-IQs pBaHhviTCeeBZbufuBYTOHz7m7D3ZStEPTBSB3u9bsp3Da pl19qomOXLhvWbH9wmXW5zm O States of Matter Sketching a described thermodynamic change on a phase diagram 0/5 Gab The temperature on a sample of pure X held at 0.75 atm and -229. °C is increased until the sample sublimes. The temperature is then held constant and the pressure is decreased by 0.50 atm. On the phase diagram below draw a path that shows this set of changes. F3 pressure (atm) 0- 0 200 Explanation temperature (K) Check F4 F5 ☀+ Q Search Chill Will an 9 ENG F6 F7 F8 F9 8 Delete F10 F11 F12 Insert PrtSc 114 d Ararrow_forwardx + LEKS: Using a phase diagram a X n/alekscgi/x/lsl.exe/10_u-IgNsikr7j8P3jH-IQs_pBan HhvlTCeeBZbufu BYTI0Hz7m7D3ZcHYUt80XL-5alyVpw ○ States of Matter Using a phase diagram to find a phase transition temperature or pressure Use the phase diagram of Substance X below to find the melting point of X when the pressure above the solid is 1.1 atm. pressure (atm) 16 08- solid liquid- 0 200 400 gas 600 temperature (K) Note: your answer must be within 25 °C of the exact answer to be graded correct. × 5arrow_forward
arrow_back_ios
SEE MORE QUESTIONS
arrow_forward_ios
Recommended textbooks for you

 Organic ChemistryChemistryISBN:9781305580350Author:William H. Brown, Brent L. Iverson, Eric Anslyn, Christopher S. FootePublisher:Cengage Learning
Organic Chemistry
Chemistry
ISBN:9781305580350
Author:William H. Brown, Brent L. Iverson, Eric Anslyn, Christopher S. Foote
Publisher:Cengage Learning
NMR Spectroscopy; Author: Professor Dave Explains;https://www.youtube.com/watch?v=SBir5wUS3Bo;License: Standard YouTube License, CC-BY