
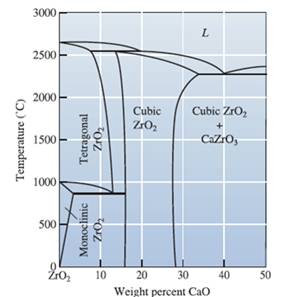
(a)
Interpretation:
To determine eutectoid temperature, the composition of phase, amount of each phase of ZrO2-CaO.
Concept Introduction:
The graphical representation of the physical state of a substance which is under various conditions of pressure and temperature is known as phase diagram. A phase diagram has temperature on the x-axis and pressure on the y-axis. It is a type of chart which is used to demonstrate conditions at which
Answer to Problem 12.74P
The percentage of monoclinic and cubic is
Explanation of Solution
Sketch a horizontal line at
Therefore, from the graph mentioned above, the percentage of Monoclinic,
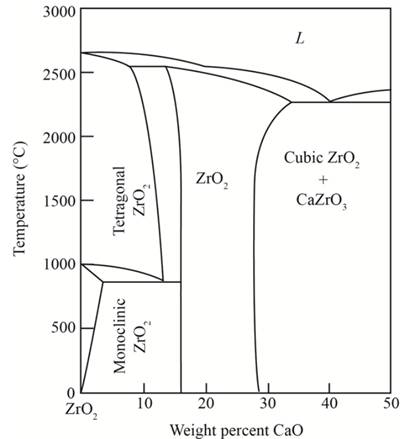
(b)
Interpretation:
To determine the eutectoid temperature, composition and amount of phase in Cu-Al at
Concept Introduction:
The graphical representation of the physical state of a substance which is under various conditions of pressure and temperature is known as phase diagram. A phase diagram has temperature on the x-axis and pressure on the y-axis. It is a type of chart which is used to demonstrate conditions at which thermodynamically different phases takes place and coexist at equilibrium.
Answer to Problem 12.74P
The percentage of composition obtained are
Explanation of Solution
Draw a horizontal line that passes through
At this particular temperature, β phase transforms to a phase, as shown in the diagram above.
Therefore,
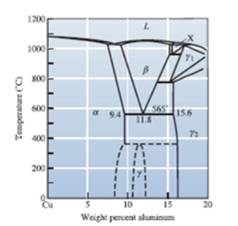
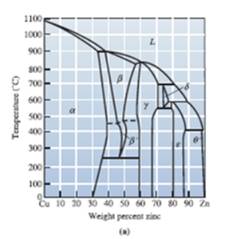
(c)
Interpretation:
To determine the eutectoid temperature, composition and amount of each phase in
Concept Introduction:
The graphical representation of the physical state of a substance which is under various conditions of pressure and temperature is known as phase diagram. A phase diagram has temperature on the x-axis and pressure on the y-axis. It is a type of chart which is used to demonstrate conditions at which thermodynamically different phases takes place and coexist at equilibrium.
Answer to Problem 12.74P
The percentage composition of a and that of
Explanation of Solution
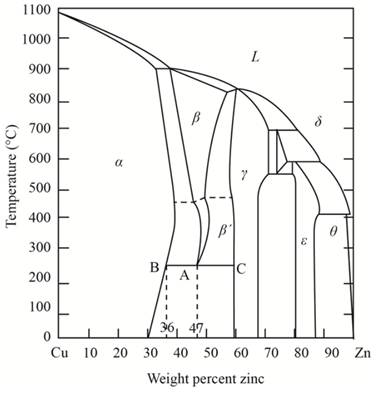
Draw a vertical line from 47 weight percent of Zinc that meets a point A. Further, from A draw the meeting point B and C, these points are in equilibrium with α and γ phases, weight percentages at these points are
Therefore,
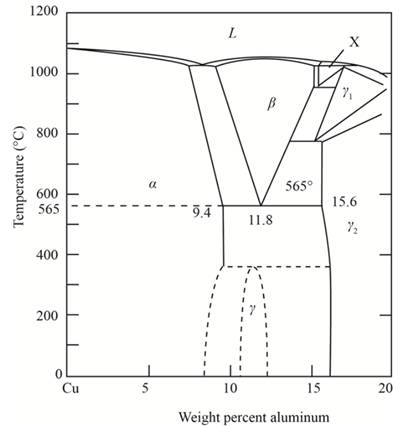
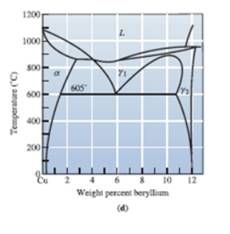
(d)
Interpretation:
To determine the eutectoid temperature amount and composition of each phase in Cu-Be.
Concept Introduction:
The graphical representation of the physical state of a substance which is under various conditions of pressure and temperature is known as phase diagram. A phase diagram has temperature on the x-axis and pressure on the y-axis. It is a type of chart which is used to demonstrate conditions at which thermodynamically different phases takes place and coexist at equilibrium.
Answer to Problem 12.74P
The percentage composition of the a phase and γ phase is obtained as 51.6% and 48.3%
Explanation of Solution
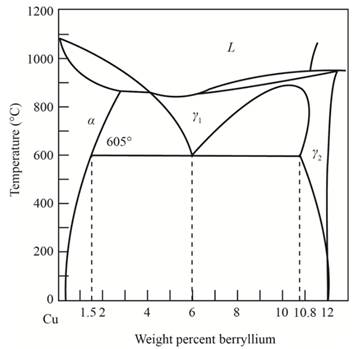
Sketch a vertical line from 6 weight percent of beryllium that meets a point A. Further, from A draw line meeting point B and C, these points are in equilibrium with phase
Want to see more full solutions like this?
Chapter 12 Solutions
Essentials of Materials Science and Engineering, SI Edition

- I have uploaded the rules, please explain step by step and which rule you have appliedarrow_forwardpls match the ans key, someone gave me a wrong ans.arrow_forwardDraw the network diagram of the following Table using PERT and determine Te, Sd, V, ES, LF, Ts and C. P. Find the probability P if D =27 weeks. Activities Prec. by To Tm Tp Te SD V ES LF Ts C.P A -- HW2 11 22U118243 10 10 1985762323443 26624452-2232 B A C -- D C E D F D G F H B, E 1 I G, H J B K J L K, I 4654arrow_forward
- For the beam and loading shown, (a) draw the shear and bending moment diagrams, (b) determine the magnitude and location of the maximum absolute value of the bending momentConsider A = 0please show step by step process, i did something wrong with bending moment diagram( length of beam = 2 + 6 + 2)arrow_forwardI have uploaded the rules, please explain step by step and which rule you have appliedarrow_forwardI have uploaded the rules, please explain step by step and which rule you have appliedarrow_forward
- SITUATION 3: A simply-supported steel beam 6 m long carries a uniform load of 25 kN/m and an axial compressive force of 250 kN. Assume both flange and web are compact. The properties of the rolled section are as follows: Show your complete solution and box only the final answer. Flange Width, bf = 210 mm Flange thickness, tf = 24 mm Overall depth, d=225 mm Web thickness, tw 14 mm Yield Strength, Fy=248 Mpa Radius of Gyration, ry = 54.342 mm Cb = 1.136 J = 2,097,256 mm² rts = 62.089 mm 1. Determine the total moment of inertia along x-axis. 2. Determine the total moment of inertia along y-axis 3. What is the allowable axial compressive strength of the beam, in kN? 4. What is the allowable flexural strength of the beam, in kN-m? 1. 108.764 x 106 mm* 2. 37.084 x 106 mm* 3. 982.304 KN 4. 166.723 KN-marrow_forwardUsing the CCS Compiler method to solve this question Write a PIC16F877A program that flash ON the 8-LED's connected to port-B by using two switches connected to port-D (Do & D₁) as shown in figure below, according to the following scenarios: (Hint: Use 500ms delay for each case with 4MHz frequency) 1. When Do=1 then B₁,B3,B7 are ON. 2. When Do 0 then Bo,B2, B4, B5, B6 are ON. 3. When D₁=1 then B4,B,,B6,B7 are ON. 4. When D₁-0 then Bo,B1,B2,B3 are ON.arrow_forwardsteel designarrow_forward
- steel designarrow_forwardSITUATION 1: A W250 x 131 is used as a column with an unbraced length of 8 m with respect to the x-x axis and 4 m with respect to the y-y axis. Assume an A36 steel member, pin-connected at the top and fixed at the bottom. Assume that the column is pin connected at mid-height. Use NSCP 2001 NSCP. Fy = 250 MPa. Properties of W250 x 131: A = 16,774 mm² d=274 mm bf=262 mm tf=25 mm tw = 16 mm Ix=222.268 x 10 mm ly = 74.505 x 10° mm* Effective Length Factors: Pinned at both ends, K = 1.0 Pinned at one end and fixed at the other, K = 0.8 1. What is the value of the slenderness ratio to be used for the column? 2. What is the nominal axial stress? 3. What is the design axial load? 1. 60.019 2. 206.543 MPa 3. 3118.091 kNarrow_forwardUse the ramp generator circuit in Fig. B2a to generate the waveform shown in Fig. B2b. Write four equations relating resistors R1, R2, R3, capacitor C and voltages Vs, VR and VA.to the waveform parameters T₁, T, Vcm and Vm- If R = R2 = R3, R₁ = 2R, C = 1 nF, Vcm = 2 V and Vm = 1 V, T₁ = 2 μs and T = 10 μs solve for the values of R, Vs, VR and VA using your equations from part a(i). VR C +VA R3 V₂ Vo мат R1 VsO+ V₁ R₂ Figure B2a Vout Vcm+Vm Vcm Vcm-Vm 0 T₁ T 2T time Figure B2barrow_forward
 MATLAB: An Introduction with ApplicationsEngineeringISBN:9781119256830Author:Amos GilatPublisher:John Wiley & Sons Inc
 Essentials Of Materials Science And EngineeringEngineeringISBN:9781337385497Author:WRIGHT, Wendelin J.Publisher:Cengage,
 Industrial Motor ControlEngineeringISBN:9781133691808Author:Stephen HermanPublisher:Cengage Learning
 Basics Of Engineering EconomyEngineeringISBN:9780073376356Author:Leland Blank, Anthony TarquinPublisher:MCGRAW-HILL HIGHER EDUCATION
 Structural Steel Design (6th Edition)EngineeringISBN:9780134589657Author:Jack C. McCormac, Stephen F. CsernakPublisher:PEARSON
 Fundamentals of Materials Science and Engineering...EngineeringISBN:9781119175483Author:William D. Callister Jr., David G. RethwischPublisher:WILEY