
Concept explainers
Videos
a
To draw
a
Explanation of Solution
Given information:
Graph:
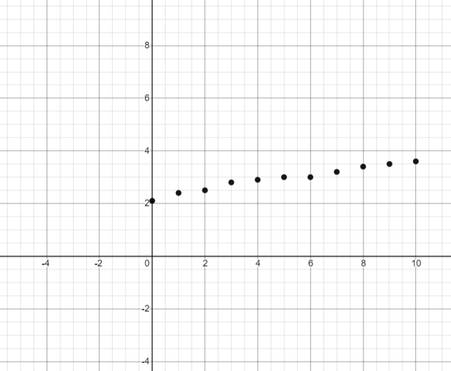
Interpretation:
Using a graphic utility, the scatter plot for the given data is shown above.
b
To find if the scatter plot could be modeled by linear model, quadratic model or neither.
b
Answer to Problem 9E
Linear model
Explanation of Solution
Given information:
To determine if the given graph can be modeled by linear model, quadratic model or neither of them, try to draw a straight line or a parabola through the given scatter plot.
If a straight line can be drawn through the points of the scatter plot, it could be modelled by linear model whereas if a parabola can be drawn through the points of the scatter plot, it could be modelled by a quadratic model.
In case if both are not possible, it could neither be modeled.
Here, in the given graph we could draw a straight line. Therefore, the scatter plot could be modeled by a linear model.
Conclusion:
Therefore, given scatter plot is modeled by linear model.
c
To find a model for the data using regression feature of a graphing utility.
c
Answer to Problem 9E
Linear model
Explanation of Solution
Given information:
Calculation:
Using the graphic utility to find the regression,
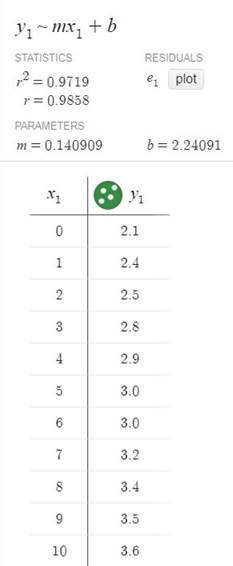
Conclusion:
Therefore, from the above figure. the regression equation for the linear model is
d
To draw the model with the scatter plot from subpart (a) using a graphic utility.
d
Explanation of Solution
Given information:
Graph:
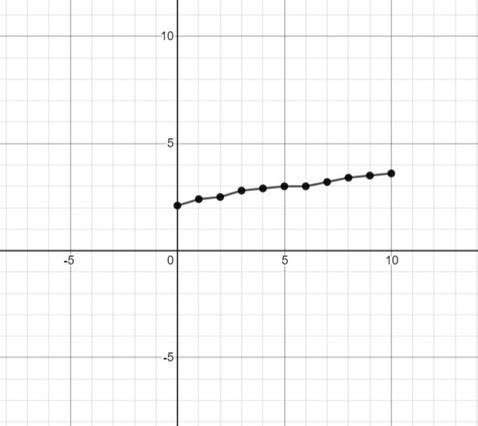
Interpretation:
Using a graphic utility, a straight line is formed when the data is kept on a graph.
e
To draw a table comparing the original data with the data given by the model.
e
Explanation of Solution
Given information:
Table:
Draw the table comparing the original data and the data given by the model.
| Original data | Data from the model | ||
| y | |||
| 0 | 2.1 | 0 | 2.24091 |
| 1 | 2.4 | 1 | 2.381819 |
| 2 | 2.5 | 2 | 2.522728 |
| 3 | 2.8 | 3 | 2.663637 |
| 4 | 2.9 | 4 | 2.804546 |
| 5 | 3.0 | 5 | 2.945455 |
| 6 | 3.0 | 6 | 3.086364 |
| 7 | 3.2 | 7 | 3.227273 |
| 8 | 3.4 | 8 | 3.51363 |
| 9 | 3.5 | 9 | 3.509091 |
| 10 | 3.6 | 10 | 3.65 |
Data from the model is obtained by substituting the values of x as
Interpretation:
When the original data and the data from the model are compared with each other, it is found that the values are nearly equal.
Chapter 2 Solutions
PRECALCULUS W/LIMITS:GRAPH.APPROACH(HS)


- Explain the key points and reasons for 12.8.2 (1) and 12.8.2 (2)arrow_forwardQ1: A slider in a machine moves along a fixed straight rod. Its distance x cm along the rod is given below for various values of the time. Find the velocity and acceleration of the slider when t = 0.3 seconds. t(seconds) x(cm) 0 0.1 0.2 0.3 0.4 0.5 0.6 30.13 31.62 32.87 33.64 33.95 33.81 33.24 Q2: Using the Runge-Kutta method of fourth order, solve for y atr = 1.2, From dy_2xy +et = dx x²+xc* Take h=0.2. given x = 1, y = 0 Q3:Approximate the solution of the following equation using finite difference method. ly -(1-y= y = x), y(1) = 2 and y(3) = −1 On the interval (1≤x≤3).(taking h=0.5).arrow_forwardConsider the function f(x) = x²-1. (a) Find the instantaneous rate of change of f(x) at x=1 using the definition of the derivative. Show all your steps clearly. (b) Sketch the graph of f(x) around x = 1. Draw the secant line passing through the points on the graph where x 1 and x-> 1+h (for a small positive value of h, illustrate conceptually). Then, draw the tangent line to the graph at x=1. Explain how the slope of the tangent line relates to the value you found in part (a). (c) In a few sentences, explain what the instantaneous rate of change of f(x) at x = 1 represents in the context of the graph of f(x). How does the rate of change of this function vary at different points?arrow_forward
- 1. The graph of ƒ is given. Use the graph to evaluate each of the following values. If a value does not exist, state that fact. и (a) f'(-5) (b) f'(-3) (c) f'(0) (d) f'(5) 2. Find an equation of the tangent line to the graph of y = g(x) at x = 5 if g(5) = −3 and g'(5) = 4. - 3. If an equation of the tangent line to the graph of y = f(x) at the point where x 2 is y = 4x — 5, find ƒ(2) and f'(2).arrow_forwardDoes the series converge or divergearrow_forwardDoes the series converge or divergearrow_forward
- Diverge or converarrow_forwardCan you help explain what I did based on partial fractions decomposition?arrow_forwardSuppose that a particle moves along a straight line with velocity v (t) = 62t, where 0 < t <3 (v(t) in meters per second, t in seconds). Find the displacement d (t) at time t and the displacement up to t = 3. d(t) ds = ["v (s) da = { The displacement up to t = 3 is d(3)- meters.arrow_forward
- Let f (x) = x², a 3, and b = = 4. Answer exactly. a. Find the average value fave of f between a and b. fave b. Find a point c where f (c) = fave. Enter only one of the possible values for c. c=arrow_forwardplease do Q3arrow_forwardUse the properties of logarithms, given that In(2) = 0.6931 and In(3) = 1.0986, to approximate the logarithm. Use a calculator to confirm your approximations. (Round your answers to four decimal places.) (a) In(0.75) (b) In(24) (c) In(18) 1 (d) In ≈ 2 72arrow_forward
 Calculus: Early TranscendentalsCalculusISBN:9781285741550Author:James StewartPublisher:Cengage Learning
 Thomas' Calculus (14th Edition)CalculusISBN:9780134438986Author:Joel R. Hass, Christopher E. Heil, Maurice D. WeirPublisher:PEARSON
 Calculus: Early Transcendentals (3rd Edition)CalculusISBN:9780134763644Author:William L. Briggs, Lyle Cochran, Bernard Gillett, Eric SchulzPublisher:PEARSON
 Calculus: Early TranscendentalsCalculusISBN:9781319050740Author:Jon Rogawski, Colin Adams, Robert FranzosaPublisher:W. H. Freeman
 Calculus: Early Transcendental FunctionsCalculusISBN:9781337552516Author:Ron Larson, Bruce H. EdwardsPublisher:Cengage Learning