
Videos
a.
To graph: The
a.
Explanation of Solution
Given:
Following data is given in the form of a table
| Year | Tuberculosis cases, N (in thousands) |
| 1991 | 26.283 |
| 1992 | 26.673 |
| 1993 | 25.102 |
| 1994 | 24.206 |
| 1995 | 22.726 |
| 1996 | 21.210 |
| 1997 | 19.751 |
| 1998 | 18.286 |
| 1999 | 17.499 |
| 2000 | 16.308 |
| 2001 | 15.945 |
| 2002 | 15.055 |
| 2003 | 14.835 |
| 2004 | 14.499 |
| 2005 | 14.065 |
| 2006 | 13.728 |
| 2007 | 13.281 |
| 2008 | 12.890 |
| 2009 | 11.517 |
| 2010 | 11.157 |
| 2011 | 10.509 |
| 2012 | 9.940 |
| 2013 | 9.561 |
| 2014 | 9.398 |
| 2015 | 9.547 |
| 2016 | 9.272 |
The data can be modelled by the rational model
Graph:
By using the above data, points and the model can be plotted as
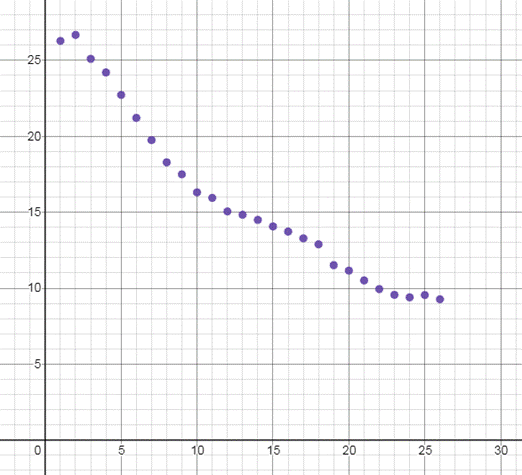
Interpretation:
The graph shows has years on x -axis and tuberculosis cases on y -axis. The number of tuberculosis patient decrease as we go from year 1991 to 2016.
b.
To find: The number of tuberculosis cases with the rational model given.
b.
Explanation of Solution
Given:
The scatter plot of the data

Calculation:
| Year | Tuberculosis cases, N (in thousands) |
| 1991 | 27.695 |
| 1992 | 26.145 |
| 1993 | 24.730 |
| 1994 | 23.433 |
| 1995 | 22.24 |
| 1996 | 21.138 |
| 1997 | 20.118 |
| 1998 | 19.171 |
| 1999 | 18.289 |
| 2000 | 17.466 |
| 2001 | 16.696 |
| 2002 | 15.975 |
| 2003 | 15.296 |
| 2004 | 14.658 |
| 2005 | 14.057 |
| 2006 | 13.488 |
| 2007 | 12.951 |
| 2008 | 12.442 |
| 2009 | 11.958 |
| 2010 | 11.5 |
| 2011 | 11.063 |
| 2012 | 10.647 |
| 2013 | 10.251 |
| 2014 | 9.872 |
| 2015 | 9.511 |
| 2016 | 9.165 |
c.
To compare: The given data and the data obtained from rational regression.
c.
Explanation of Solution
Given: Data in the form of table
Calculation:
| Year | Tuberculosis cases, N (in thousands) | Tuberculosis cases, N (in thousands)
(from the regression model) | Difference |
| 1991 | 26.283 | 27.695 | 1.412 |
| 1992 | 26.673 | 26.145 | -0.528 |
| 1993 | 25.102 | 24.730 | -0.372 |
| 1994 | 24.206 | 23.433 | -0.773 |
| 1995 | 22.726 | 22.24 | -0.486 |
| 1996 | 21.210 | 21.138 | -0.072 |
| 1997 | 19.751 | 20.118 | 0.367 |
| 1998 | 18.286 | 19.171 | 0.885 |
| 1999 | 17.499 | 18.289 | 0.79 |
| 2000 | 16.308 | 17.466 | 1.158 |
| 2001 | 15.945 | 16.696 | 0.751 |
| 2002 | 15.055 | 15.975 | 0.92 |
| 2003 | 14.835 | 15.296 | 0.461 |
| 2004 | 14.499 | 14.658 | 0.159 |
| 2005 | 14.065 | 14.057 | -0.008 |
| 2006 | 13.728 | 13.488 | -0.24 |
| 2007 | 13.281 | 12.951 | -0.33 |
| 2008 | 12.890 | 12.442 | -0.448 |
| 2009 | 11.517 | 11.958 | 0.441 |
| 2010 | 11.157 | 11.5 | 0.343 |
| 2011 | 10.509 | 11.063 | 0.554 |
| 2012 | 9.940 | 10.647 | 0.707 |
| 2013 | 9.561 | 10.251 | 0.69 |
| 2014 | 9.398 | 9.872 | 0.474 |
| 2015 | 9.547 | 9.511 | -0.036 |
| 2016 | 9.272 | 9.165 | -0.107 |
As the values are very close to the actual values therefore the model is a best fit.
d.
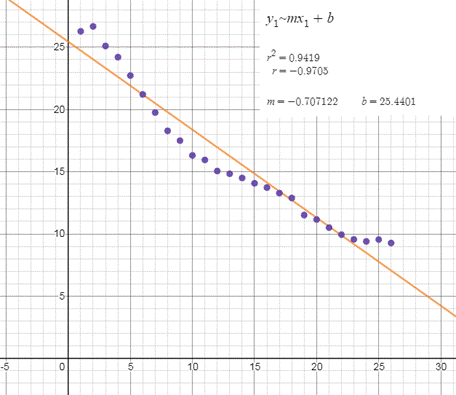
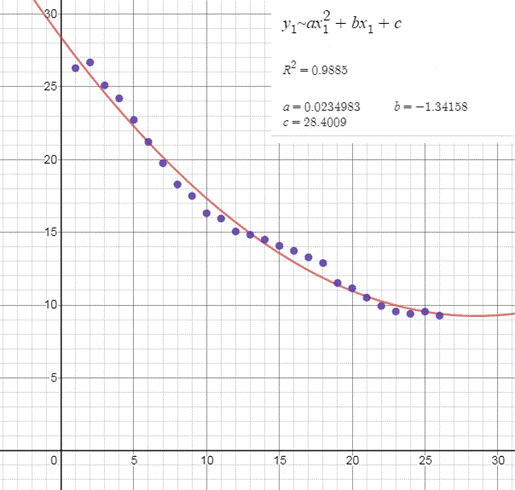
To find: The linear and quadratic model.
d.
Explanation of Solution
Given: Data in the form of table
Graph:
The linear model for the data is:
The quadratic model for the data is:
e.
To compare: the linear, quadratic and rational model of the given data.
e.
Explanation of Solution
Given:
The linear model is given by:
The quadratic model is given by:
The rational model is given by:
We have,
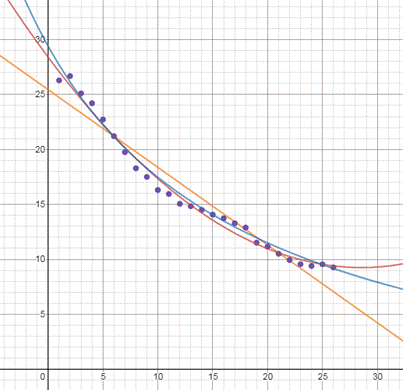
Orange line represents the linear model, blue represents the rational model and red represents the quadratic model.
As the values are far apart in linear model is not a best fit. In quadratic model values are close to the actual value but it increases after a certain point which is against the trend of the data given.
Therefore the rational model is the best fit for the given data.
f.
To find: the number of tuberculosis cases in year 2025
f.
Explanation of Solution
Given:
The linear model is given by:
The quadratic model is given by:
The rational model is given by:
Calculation:
Rational model is the best fit as it decreases the whole time which is the trend of the graph, the linear model is very far from the original values and quadratic model increase after sometimes which is not the trend for the data.
Therefore the rational model is the best fit.
For year 2025, the value of x is 34.
From rational model
Therefore the number of cases in 2025 will be 6.859.
Chapter 2 Solutions
PRECALCULUS W/LIMITS:GRAPH.APPROACH(HS)


- For each of the following series, determine whether the absolute convergence series test determines absolute convergence or fails. For the ¿th series, if the test is inconclusive then let Mi = 4, while if the test determines absolute convergence let Mi 1 : 2: ∞ Σ(−1)"+¹ sin(2n); n=1 Σ n=1 Σ ((−1)”. COS n² 3+2n4 3: (+ 4: 5 : n=1 ∞ n 2+5n3 ПП n² 2 5+2n3 пп n² Σ(+)+ n=1 ∞ n=1 COS 4 2 3+8n3 П ηπ n- (−1)+1 sin (+727) 5 + 2m³ 4 = 8. Then the value of cos(M₁) + cos(2M2) + cos(3M3) + sin(2M) + sin(M5) is -0.027 -0.621 -1.794 -1.132 -1.498 -4.355 -2.000 2.716arrow_forwardi need help with this question i tried by myself and so i am uploadding the question to be quided with step by step solution and please do not use chat gpt i am trying to learn thank you.arrow_forwardi need help with this question i tried by myself and so i am uploadding the question to be quided with step by step solution and please do not use chat gpt i am trying to learn thank you.arrow_forward
- 1. 3 2 fx=14x²-15x²-9x- 2arrow_forwardNo it is not a graded assignment, its a review question but i only have the final answer not the working or explanationarrow_forwardClass, the class silues, and the class notes, whether the series does alternate and the absolute values of the terms decrease), and if the test does apply, determine whether the series converges or diverges. For the ith series, if the test does not apply the let Mi = 2, while if the test determines divergence then M¿ = 4, and if it determines convergence then M¿ = 8. 1: 2: 3 : 4: 5 : ∞ n=1 ∞ (−1)n+1. Σ(-1) +1 n=1 ∞ п 3m² +2 Σ(-1)+1 sin(2n). n=1 ∞ 2n² + 2n +3 4n2 +6 1 e-n + n² 3n23n+1 9n² +3 In(n + 1) 2n+1 Σ(-1) +1 n=1 ∞ Σ(-1)". n=1 Then the value of cos(M₁) + cos(2M2) + cos(3M3) + sin(2M4) + sin(M5) is 1.715 0.902 0.930 -1.647 -0.057 ● 2.013 1.141 4.274arrow_forward
- 3. FCX14) = x²+3xx-y3 +.arrow_forwardA cylindrical chemical storage tank with a capacity of 950m3 is going to be constructed in a warehouse that is 11m by 14m with a height of 10m. The specifications call for the case to be made of sheet metal that costs $90/m2, the top to be made from sheet metal that costs $45/m2 and the wall to be made of sheet metal that costs $80/m2. If you want to minimize the cost to make the storage house, how much would you end up spending to build the tank?arrow_forwardCalculate the max value of the directional derivatearrow_forward
- Calculus III May I please have the example, definition semicolons, and all blanks completed and solved? Thank you so much,arrow_forwardA company estimates that the revenue (in dollars) from the sale of x doghouses is given by R(x) = 12,000 In (0.02x+1). Use the differential to approximate the change in revenue from the sale of one more doghouse if 80 doghouses have already been sold. The revenue will increase by $ if one more doghouse is made. (Round to the nearest cent as needed.)arrow_forwardThe population of bacteria (in millions) in a certain culture x hours after an experimental 20x nutrient is introduced into the culture is P(x) = - 2 Use the differential to approximate the changes in population for the following changes in x. 8+x a. 1 to 1.5 b. 3 to 3.25 a. Use the differential to approximate the change in population for x=1 to 1.5. Between 1 and 1.5 hours, the population of bacteria changes by million. (Round to three decimal places as needed.)arrow_forward
 Calculus: Early TranscendentalsCalculusISBN:9781285741550Author:James StewartPublisher:Cengage Learning
 Thomas' Calculus (14th Edition)CalculusISBN:9780134438986Author:Joel R. Hass, Christopher E. Heil, Maurice D. WeirPublisher:PEARSON
 Calculus: Early Transcendentals (3rd Edition)CalculusISBN:9780134763644Author:William L. Briggs, Lyle Cochran, Bernard Gillett, Eric SchulzPublisher:PEARSON
 Calculus: Early TranscendentalsCalculusISBN:9781319050740Author:Jon Rogawski, Colin Adams, Robert FranzosaPublisher:W. H. Freeman
 Calculus: Early Transcendental FunctionsCalculusISBN:9781337552516Author:Ron Larson, Bruce H. EdwardsPublisher:Cengage Learning