
Concept explainers
Videos
a.
To draw:
a.
Explanation of Solution
Given:
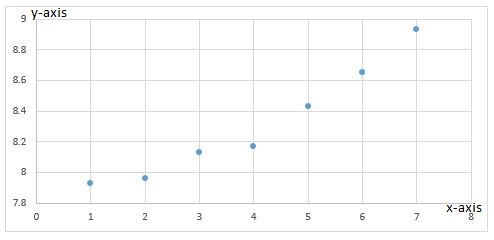
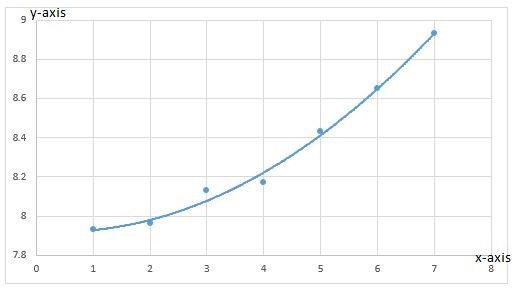
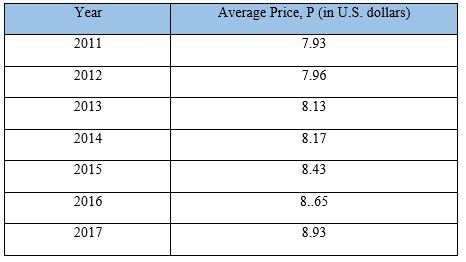
Following data is given in the form of a table

Graph:
By using the above data, scatter plot is drawn.
Interpretation:
The graph shows that average ticket price has been consistently on the rise.
b.
To find: a linear model using regression utility for the given data and identify the coefficient of determination.
b.
Explanation of Solution
Given:
Following data is given in the form of a table

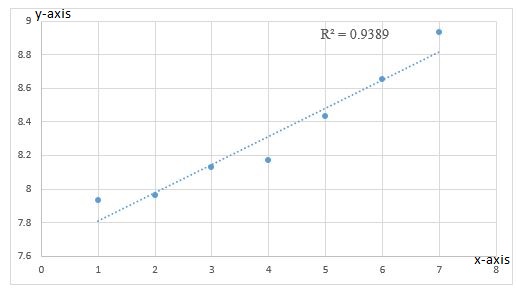
Graph:
Interpretation:
The given graph shows an almost similar increase according to the linear model.
Here, there are 3 points which lying on the line, thus indicating certain accuracy.
The coefficient of determination is
c.
To find: a linear model with the scatter plot from part (a).
c.
Explanation of Solution
Given:
Following data is given in the form of a table

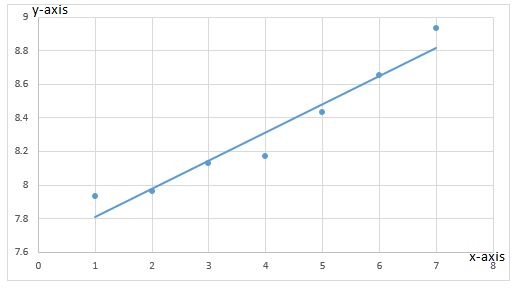
Graph:
Interpretation:
The given graph shows an almost similar increase according to the linear model.
Here, there are 3 points which lying on the line, thus indicating certain accuracy.
d.
To find: a quadratic model using regression utility for the given data and its coefficient of determination.
d.
Explanation of Solution
Given:
Following data is given in the form of a table

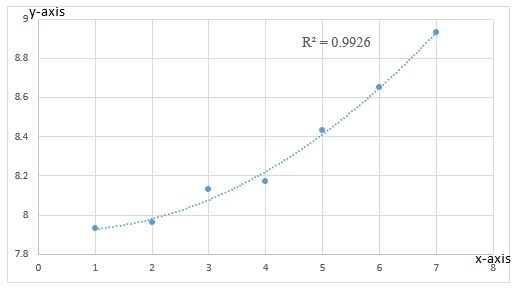
Graph:
Interpretation:
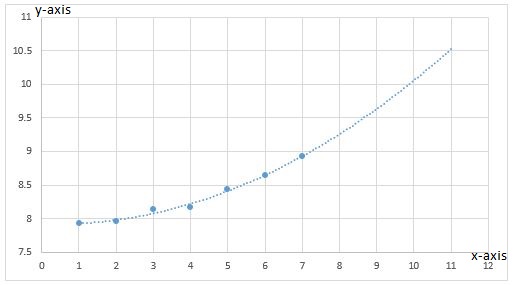
The given graph shows that the curve moves almost similar to the quadratic model. Also there are 4 point lying on the quadratic model thus indicating a comparatively higher accuracy as compared to linear model.
The coefficient of determination is
e.
To find: a quadratic model for the given data.
e.
Explanation of Solution
Given:
Following data is given in the form of a table

Graph:
Interpretation:
The given graph shows that the curve moves almost similar to the quadratic model. Also there are 4 point lying on the quadratic model thus indicating a comparatively higher accuracy as compared to linear model
f.
To find: a better model fit for the data.
f.
Explanation of Solution
Given:
Following data is given in the form of a table
On observation of linear model and the quadratic model, it can be easily said that the quadratic models is better as it closely follows the actual movement of the graph.
This is not true in the case of linear model where only 3 of the points lie on the line as compared to 4 in case of quadratic model.
Conclusion:
Quadratic model is better fit for the data given as the difference between two consecutive values is not constant.
g.
To find: the year when the average movie ticket price is $10.25 using quadratic model.
g.
Explanation of Solution
Given:
Following data is given in the form of a table

Graph:
Interpretation:
Observing the quadratic model, it can be said that the average movie ticket price will be $10.25 in year
Conclusion:
The given data follows a similar pattern to the quadratic model.
This helps in finding the time when the graph will have certain value in the future.
Chapter 2 Solutions
PRECALCULUS W/LIMITS:GRAPH.APPROACH(HS)


- 2. Consider the following: Prove that x, x2, and 1/x are the solutions to the homogeneous equation corresponding to x³y"" + x²y" + 2xy' + 2y = 2x4. b. use variation of parameters to find a particular solution and complete the general solution to the differential equation. I am interested in process. You may use a computer for integration, finding determinants and doing Kramer's.arrow_forward3. A spring is stretched 6 in. by a mass that weighs 8 lb. The mass is attached to a dashpot mechanism that has a damping constant of 0.25 lb-sec./ft. and is acted on by an external force of 4 cos 2t lb. a. Set-up the differential equation and initial value problem for the system. b. Write the function in phase-amplitude form. C. Determine the transient solution to the system. Show your work. d. Determine the steady state of this system. Show your work. e. Is the system underdamped, overdamped or critically damped? Explain what this means for the system.arrow_forward4. Suppose that you have a circuit with a resistance of 20, inductance of 14 H and a capacitance of 11 F. An EMF with equation of E(t) = 6 cos 4t supplies a continuous charge 60 to the circuit. Suppose that the q(0)= 8 V and the q'(0)=7. Use this information to answer the following questions a. Find the function that models the charge of this circuit. b. Is the circuit underdamped, overdamped or critically damped?arrow_forward
- 1. Solve the initial value problem: y" -11y' + 30y = x³e6x y(0) 11, y'(0) = 36 =arrow_forwardWhat is the particular solution to the differential equation y′′ + y = 1/cos t ?arrow_forwardWhich of the following is the general solution to y′′ + 4y = e^2t + 12 sin(2t) ?A. y(t) = c1 cos(2t) + c2 sin(2t) + 1/8 e^2t − 3t cos(2t)B. y(t) = c1e^2t + c2e^−2t + 1/4 te^2t − 3t cos(2t)C. y(t) = c1 + c2e^−4t + 1/12 te^2t − 3t cos(2t)D. y(t) = c1 cos(2t) + c2 sin(2t) + 1/8 e^2t + 3 sin(2t)E. None of the above. Please include all steps! Thank you!arrow_forward
- Show that i cote +1 = cosec 20 tan 20+1 = sec² O २ cos² + sin 20 = 1 using pythagon's theoremarrow_forwardFind the general solution to the differential equationarrow_forwardcharity savings Budget for May travel food Peter earned $700 during May. The graph shows how the money was used. What fraction was clothes? O Search Submit clothes leisurearrow_forward
- Exercise 11.3 A slope field is given for the equation y' = 4y+4. (a) Sketch the particular solution that corresponds to y(0) = −2 (b) Find the constant solution (c) For what initial conditions y(0) is the solution increasing? (d) For what initial conditions y(0) is the solution decreasing? (e) Verify these results using only the differential equation y' = 4y+4.arrow_forwardAphids are discovered in a pear orchard. The Department of Agriculture has determined that the population of aphids t hours after the orchard has been sprayed is approximated by N(t)=1800−3tln(0.17t)+t where 0<t≤1000. Step 1 of 2: Find N(63). Round to the nearest whole number.arrow_forward3. [-/3 Points] DETAILS MY NOTES SCALCET8 7.4.032. ASK YOUR TEACHER PRACTICE ANOTHER Evaluate the integral. X + 4x + 13 Need Help? Read It SUBMIT ANSWER dxarrow_forward
 Calculus: Early TranscendentalsCalculusISBN:9781285741550Author:James StewartPublisher:Cengage Learning
 Thomas' Calculus (14th Edition)CalculusISBN:9780134438986Author:Joel R. Hass, Christopher E. Heil, Maurice D. WeirPublisher:PEARSON
 Calculus: Early Transcendentals (3rd Edition)CalculusISBN:9780134763644Author:William L. Briggs, Lyle Cochran, Bernard Gillett, Eric SchulzPublisher:PEARSON
 Calculus: Early TranscendentalsCalculusISBN:9781319050740Author:Jon Rogawski, Colin Adams, Robert FranzosaPublisher:W. H. Freeman
 Calculus: Early Transcendental FunctionsCalculusISBN:9781337552516Author:Ron Larson, Bruce H. EdwardsPublisher:Cengage Learning