
Concept explainers
Videos
a.
To draw: A
a.
Explanation of Solution
Given information:
Following data is given in the form of a table
Graph:
By using a graphing utility, a scatter plot is drawn below for given data.
Interpretation:
The given graph shows growth similar to an exponential growth.
b.
To find: The linear model for the data given and identify the coefficient of determination.
b.
Explanation of Solution
Given information:
Following data is given in the form of a table
Graph:
Interpretation:
From the given graph it can said the coefficient of determination is
c.
To graph: A linear model with the scatter plot from part (a).
c.
Explanation of Solution
Given information:
Following data is given in the form of a table
Graph:
Interpretation:
The linear model of scatter plot gives a graph similar to a parabola thus indicating its exponential growth.
d.
To find:The find the quadratic model for the data and identify the coefficient of determination.
d.
Explanation of Solution
Given information:
Following data is given in the form of a table
Graph:
Interpretation:
From the graph it can be observed that coefficient of determination of quadratic model is
e.
To graph: A quadratic model with the scatter plot from part (a).
e.
Explanation of Solution
Given information:
Following data is given in the form of a table
Graph:
Interpretation:
The quadratic model of the scatter plot is much more continuous as compared to linear model thus increasing the accuracy to predict the future growth.
f.
To conclude: Which model (linear or quadratic) is better for the given set of data.
f.
Explanation of Solution
Given information:
Following data is given in the form of a table
For the given data, quadratic model will be better fit for data as it has a variable and positive increase in the y-axis.The difference between 2 points is not constant and it keeps on increasing just like a graph for
The linear model doesn’t consider the increasing slope of the equation, which is it fails to identify a relation between two adjacent slopes of a line.
g.
To find: The year when the revenue will reach approximately 8185 million dollars.
g.
Explanation of Solution
Given information:
Following data is given in the form of a table
To determine a year where the revenue becomes approximately 8185 million, quadratic model can be used.
Graph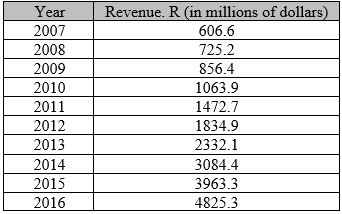
Interpretation:
From the quadratic model , it can be inferred that the revenue of company will become approximately 8185 million dollars by
Chapter 2 Solutions
EP PRECALC.GRAPHING APPR.-WEBASSIGN-1YR


 Calculus: Early TranscendentalsCalculusISBN:9781285741550Author:James StewartPublisher:Cengage Learning
 Thomas' Calculus (14th Edition)CalculusISBN:9780134438986Author:Joel R. Hass, Christopher E. Heil, Maurice D. WeirPublisher:PEARSON
 Calculus: Early Transcendentals (3rd Edition)CalculusISBN:9780134763644Author:William L. Briggs, Lyle Cochran, Bernard Gillett, Eric SchulzPublisher:PEARSON
 Calculus: Early TranscendentalsCalculusISBN:9781319050740Author:Jon Rogawski, Colin Adams, Robert FranzosaPublisher:W. H. Freeman
 Calculus: Early Transcendental FunctionsCalculusISBN:9781337552516Author:Ron Larson, Bruce H. EdwardsPublisher:Cengage Learning