
Concept explainers
Videos
a.
To draw:
a.
Explanation of Solution
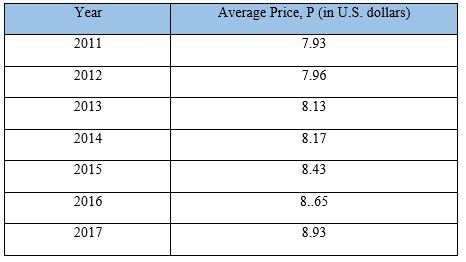
Given:
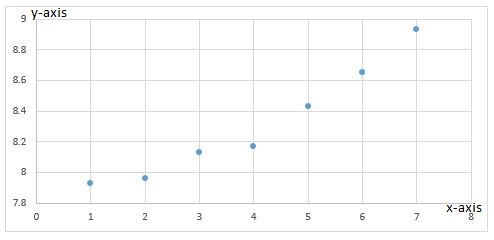
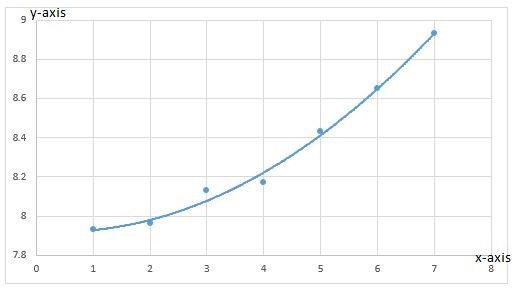
Following data is given in the form of a table

Graph:
By using the above data, scatter plot is drawn.
Interpretation:
The graph shows that average ticket price has been consistently on the rise.
b.
To find: a linear model using regression utility for the given data and identify the coefficient of determination.
b.
Explanation of Solution
Given:
Following data is given in the form of a table

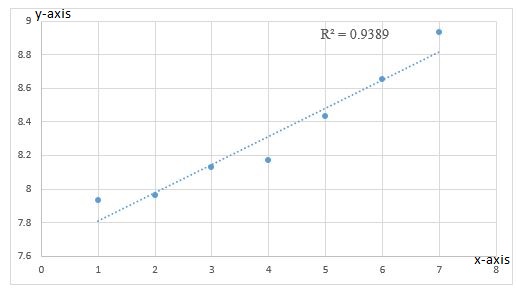
Graph:
Interpretation:
The given graph shows an almost similar increase according to the linear model.
Here, there are 3 points which lying on the line, thus indicating certain accuracy.
The coefficient of determination is
c.
To find: a linear model with the scatter plot from part (a).
c.
Explanation of Solution
Given:
Following data is given in the form of a table

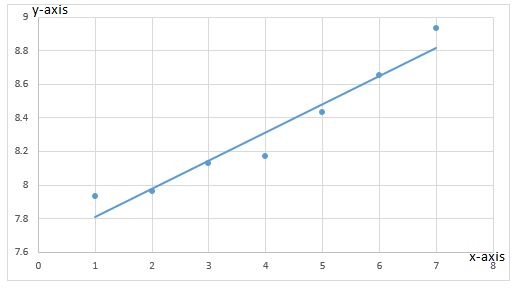
Graph:
Interpretation:
The given graph shows an almost similar increase according to the linear model.
Here, there are 3 points which lying on the line, thus indicating certain accuracy.
d.
To find: a quadratic model using regression utility for the given data and its coefficient of determination.
d.
Explanation of Solution
Given:
Following data is given in the form of a table

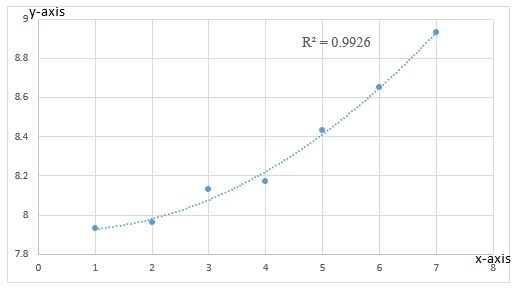
Graph:
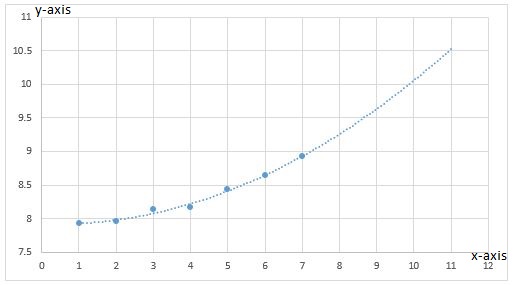
Interpretation:
The given graph shows that the curve moves almost similar to the quadratic model. Also there are 4 point lying on the quadratic model thus indicating a comparatively higher accuracy as compared to linear model.
The coefficient of determination is
e.
To find: a quadratic model for the given data.
e.
Explanation of Solution
Given:
Following data is given in the form of a table

Graph:
Interpretation:
The given graph shows that the curve moves almost similar to the quadratic model. Also there are 4 point lying on the quadratic model thus indicating a comparatively higher accuracy as compared to linear model
f.
To find: a better model fit for the data.
f.
Explanation of Solution
Given:
Following data is given in the form of a table
On observation of linear model and the quadratic model, it can be easily said that the quadratic models is better as it closely follows the actual movement of the graph.
This is not true in the case of linear model where only 3 of the points lie on the line as compared to 4 in case of quadratic model.
Conclusion:
Quadratic model is better fit for the data given as the difference between two consecutive values is not constant.
g.
To find: the year when the average movie ticket price is $10.25 using quadratic model.
g.
Explanation of Solution
Given:
Following data is given in the form of a table

Graph:
Interpretation:
Observing the quadratic model, it can be said that the average movie ticket price will be $10.25 in year
Conclusion:
The given data follows a similar pattern to the quadratic model.
This helps in finding the time when the graph will have certain value in the future.
Chapter 2 Solutions
EP PRECALC.GRAPHING APPR.-WEBASSIGN-1YR


- Find the accumulated amount A, if the principal P is invested at an interest rate of r per year for t years. (Round your answer to the nearest cent.) P = $3800, r = 4%, t = 10, compounded semiannually A = $ 5645.60 × Need Help? Read It SUBMIT ANSWER [3.33/6.66 Points] DETAILS MY NOTES REVIOUS ANSWERS ASK YOUR TEACHER TANAPCALC10 5.3.001.EP. PRACTICE ANOTHER Consider the following where the principal P is invested at an interest rate of r per year for t years. P = $3,100, r = 4%, t = 10, compounded semiannually Determine m, the number of conversion periods per year. 2 Find the accumulated amount A (in dollars). (Round your answer to the nearest cent.) A = $ 4604.44arrow_forwardForce with 800 N and 400 N are acting on a machine part at 30° and 60°, respectively with a positive x axis, Draw the diagram representing this situationarrow_forwardI forgot to mention to you to solve question 1 and 2. Can you solve it using all data that given in the pict i given and can you teach me about that.arrow_forward
 Calculus: Early TranscendentalsCalculusISBN:9781285741550Author:James StewartPublisher:Cengage Learning
 Thomas' Calculus (14th Edition)CalculusISBN:9780134438986Author:Joel R. Hass, Christopher E. Heil, Maurice D. WeirPublisher:PEARSON
 Calculus: Early Transcendentals (3rd Edition)CalculusISBN:9780134763644Author:William L. Briggs, Lyle Cochran, Bernard Gillett, Eric SchulzPublisher:PEARSON
 Calculus: Early TranscendentalsCalculusISBN:9781319050740Author:Jon Rogawski, Colin Adams, Robert FranzosaPublisher:W. H. Freeman
 Calculus: Early Transcendental FunctionsCalculusISBN:9781337552516Author:Ron Larson, Bruce H. EdwardsPublisher:Cengage Learning