
Videos
a.
To graph: The
a.
Explanation of Solution
Given:
Following data is given in the form of a table
| Year | Tuberculosis cases, N (in thousands) |
| 1991 | 26.283 |
| 1992 | 26.673 |
| 1993 | 25.102 |
| 1994 | 24.206 |
| 1995 | 22.726 |
| 1996 | 21.210 |
| 1997 | 19.751 |
| 1998 | 18.286 |
| 1999 | 17.499 |
| 2000 | 16.308 |
| 2001 | 15.945 |
| 2002 | 15.055 |
| 2003 | 14.835 |
| 2004 | 14.499 |
| 2005 | 14.065 |
| 2006 | 13.728 |
| 2007 | 13.281 |
| 2008 | 12.890 |
| 2009 | 11.517 |
| 2010 | 11.157 |
| 2011 | 10.509 |
| 2012 | 9.940 |
| 2013 | 9.561 |
| 2014 | 9.398 |
| 2015 | 9.547 |
| 2016 | 9.272 |
The data can be modelled by the rational model
Graph:
By using the above data, points and the model can be plotted as
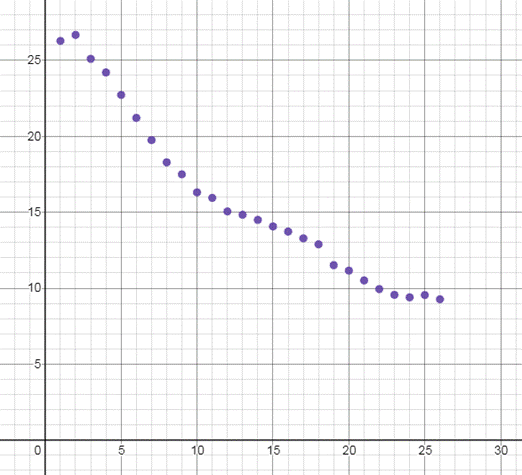
Interpretation:
The graph shows has years on x -axis and tuberculosis cases on y -axis. The number of tuberculosis patient decrease as we go from year 1991 to 2016.
b.
To find: The number of tuberculosis cases with the rational model given.
b.
Explanation of Solution
Given:
The scatter plot of the data

Calculation:
| Year | Tuberculosis cases, N (in thousands) |
| 1991 | 27.695 |
| 1992 | 26.145 |
| 1993 | 24.730 |
| 1994 | 23.433 |
| 1995 | 22.24 |
| 1996 | 21.138 |
| 1997 | 20.118 |
| 1998 | 19.171 |
| 1999 | 18.289 |
| 2000 | 17.466 |
| 2001 | 16.696 |
| 2002 | 15.975 |
| 2003 | 15.296 |
| 2004 | 14.658 |
| 2005 | 14.057 |
| 2006 | 13.488 |
| 2007 | 12.951 |
| 2008 | 12.442 |
| 2009 | 11.958 |
| 2010 | 11.5 |
| 2011 | 11.063 |
| 2012 | 10.647 |
| 2013 | 10.251 |
| 2014 | 9.872 |
| 2015 | 9.511 |
| 2016 | 9.165 |
c.
To compare: The given data and the data obtained from rational regression.
c.
Explanation of Solution
Given: Data in the form of table
Calculation:
| Year | Tuberculosis cases, N (in thousands) | Tuberculosis cases, N (in thousands)
(from the regression model) | Difference |
| 1991 | 26.283 | 27.695 | 1.412 |
| 1992 | 26.673 | 26.145 | -0.528 |
| 1993 | 25.102 | 24.730 | -0.372 |
| 1994 | 24.206 | 23.433 | -0.773 |
| 1995 | 22.726 | 22.24 | -0.486 |
| 1996 | 21.210 | 21.138 | -0.072 |
| 1997 | 19.751 | 20.118 | 0.367 |
| 1998 | 18.286 | 19.171 | 0.885 |
| 1999 | 17.499 | 18.289 | 0.79 |
| 2000 | 16.308 | 17.466 | 1.158 |
| 2001 | 15.945 | 16.696 | 0.751 |
| 2002 | 15.055 | 15.975 | 0.92 |
| 2003 | 14.835 | 15.296 | 0.461 |
| 2004 | 14.499 | 14.658 | 0.159 |
| 2005 | 14.065 | 14.057 | -0.008 |
| 2006 | 13.728 | 13.488 | -0.24 |
| 2007 | 13.281 | 12.951 | -0.33 |
| 2008 | 12.890 | 12.442 | -0.448 |
| 2009 | 11.517 | 11.958 | 0.441 |
| 2010 | 11.157 | 11.5 | 0.343 |
| 2011 | 10.509 | 11.063 | 0.554 |
| 2012 | 9.940 | 10.647 | 0.707 |
| 2013 | 9.561 | 10.251 | 0.69 |
| 2014 | 9.398 | 9.872 | 0.474 |
| 2015 | 9.547 | 9.511 | -0.036 |
| 2016 | 9.272 | 9.165 | -0.107 |
As the values are very close to the actual values therefore the model is a best fit.
d.
To find: The linear and quadratic model.
d.
Explanation of Solution
Given: Data in the form of table
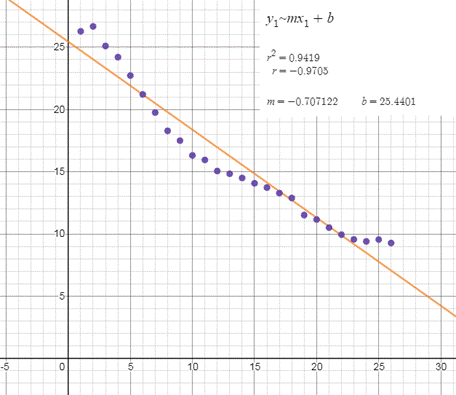
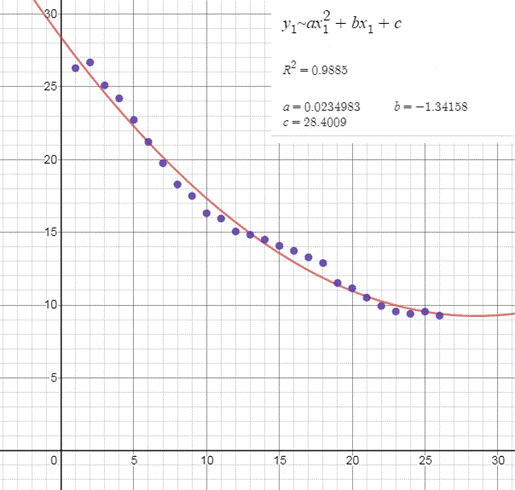
Graph:
The linear model for the data is:
The quadratic model for the data is:
e.
To compare: the linear, quadratic and rational model of the given data.
e.
Explanation of Solution
Given:
The linear model is given by:
The quadratic model is given by:
The rational model is given by:
We have,
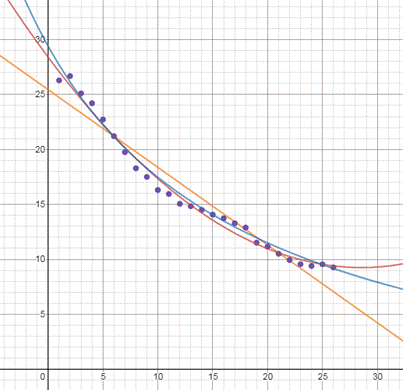
Orange line represents the linear model, blue represents the rational model and red represents the quadratic model.
As the values are far apart in linear model is not a best fit. In quadratic model values are close to the actual value but it increases after a certain point which is against the trend of the data given.
Therefore the rational model is the best fit for the given data.
f.
To find: the number of tuberculosis cases in year 2025
f.
Explanation of Solution
Given:
The linear model is given by:
The quadratic model is given by:
The rational model is given by:
Calculation:
Rational model is the best fit as it decreases the whole time which is the trend of the graph, the linear model is very far from the original values and quadratic model increase after sometimes which is not the trend for the data.
Therefore the rational model is the best fit.
For year 2025, the value of x is 34.
From rational model
Therefore the number of cases in 2025 will be 6.859.
Chapter 2 Solutions
EP PRECALC.GRAPHING APPR.-WEBASSIGN-1YR


- #3 Find the derivative y' = of the following functions, using the derivative rules: dx a) y-Cos 6x b) y=x-Sin4x c) y=x-Cos3x d) y=x-R CD-X:-:TCH :D:D:D - Sin f) Sin(x²) (9) Tan (x³)arrow_forwardmate hat is the largest area that can be en 18 For the function y=x³-3x² - 1, use derivatives to: (a) determine the intervals of increase and decrease. (b) determine the local (relative) maxima and minima. (c) determine the intervals of concavity. (d) determine the points of inflection. b) (e) sketch the graph with the above information indicated on the graph.arrow_forwarduse L'Hopital Rule to evaluate the following. a) 4x3 +10x2 23009׳-9 943-9 b) hm 3-84 хто бу+2 < xan x-30650)arrow_forward
- Evaluate the next integralarrow_forward1. For each of the following, find the critical numbers of f, the intervals on which f is increasing or decreasing, and the relative maximum and minimum values of f. (a) f(x) = x² - 2x²+3 (b) f(x) = (x+1)5-5x-2 (c) f(x) = x2 x-9 2. For each of the following, find the intervals on which f is concave upward or downward and the inflection points of f. (a) f(x) = x - 2x²+3 (b) g(x) = x³- x (c) f(x)=x-6x3 + x-8 3. Find the relative maximum and minimum values of the following functions by using the Second Derivative Test. (a) f(x)=1+3x² - 2x3 (b) g(x) = 2x3 + 3x² - 12x-4arrow_forwardFind the Soultion to the following dy differential equation using Fourier in transforms: = , хуо, ухо according to the terms: lim u(x,y) = 0 x18 lim 4x (x,y) = 0 x14 2 u (x, 0) = =\u(o,y) = -y لوarrow_forward
- Can you solve question 3,4,5 and 6 for this questionarrow_forwardwater at a rate of 2 m³/min. of the water height in this tank? 16) A box with a square base and an open top must have a volume of 256 cubic inches. Find the dimensions of the box that will minimize the amount of material used (the surface area). 17) A farmer wishes toarrow_forward#14 Sand pours from a chute and forms a conical pile whose height is always equal to its base diameter. The height o the pile increases at a rate of 5 feet/hour. Find the rate of change of the volume of the sand in the conical pile when the height of the pile is 4 feet.arrow_forward
- (d)(65in(x)-5 cos(x) dx mins by 5x-2x² 3x+1 dx -dx 20 Evaluate each the following indefinite integralsarrow_forward19 Evaluate each the following definite integrals: a) લ b) (+3) 6) (2-2)(+33) dxarrow_forward#11 If a snowball melts so its surface area decreases at a rate of 1cm²/min, find the rate at which the diameter decreases when the diameter is 6 cm.arrow_forward
 Calculus: Early TranscendentalsCalculusISBN:9781285741550Author:James StewartPublisher:Cengage Learning
 Thomas' Calculus (14th Edition)CalculusISBN:9780134438986Author:Joel R. Hass, Christopher E. Heil, Maurice D. WeirPublisher:PEARSON
 Calculus: Early Transcendentals (3rd Edition)CalculusISBN:9780134763644Author:William L. Briggs, Lyle Cochran, Bernard Gillett, Eric SchulzPublisher:PEARSON
 Calculus: Early TranscendentalsCalculusISBN:9781319050740Author:Jon Rogawski, Colin Adams, Robert FranzosaPublisher:W. H. Freeman
 Calculus: Early Transcendental FunctionsCalculusISBN:9781337552516Author:Ron Larson, Bruce H. EdwardsPublisher:Cengage Learning