
Concept explainers
Videos
a
To draw
a
Explanation of Solution
Given information:
Graph:
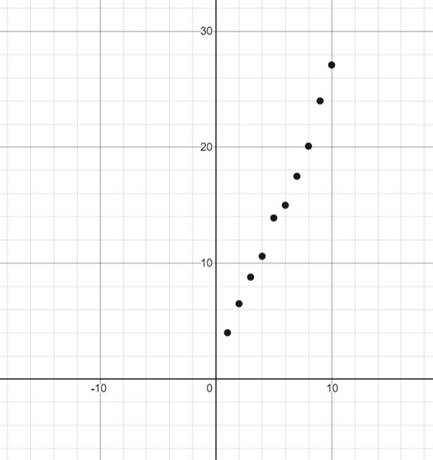
Interpretation:
Using a graphic utility, the scatter plot for the given data is shown above.
b
To find if the scatter plot could be modeled by linear model, quadratic model or neither.
b
Answer to Problem 13E
Linear model
Explanation of Solution
Given information:
To determine if the given graph can be modeled by linear model, quadratic model or neither of them, try to draw a straight line or a parabola through the given scatter plot.
If a straight line can be drawn through the points of the scatter plot, it could be modelled by linear model whereas if a parabola can be drawn through the points of the scatter plot, it could be modelled by a quadratic model.
In case if both are not possible, it could neither be modeled.
Here, in the given graph we could draw a straight line. Therefore, the scatter plot could be modeled by a linear model.
Conclusion:
Therefore, given scatter plot is modeled by linear model.
c
To find a model for the data using regression feature of a graphing utility.
c
Answer to Problem 13E
Linear model
Explanation of Solution
Given information:
Calculation:
Using the graphic utility to find the regression,
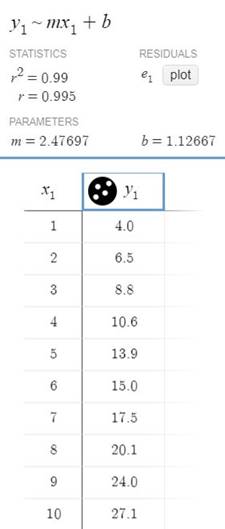
Conclusion:
Therefore, from the above figure. the regression equation for the linear model is
d
To draw the model with the scatter plot from subpart (a) using a graphic utility.
d
Explanation of Solution
Given information:
Graph:
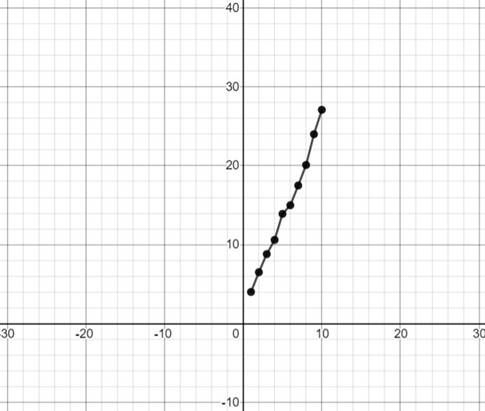
Interpretation:
Using a graphic utility, a straight line is formed when the data is kept on a graph.
e
To draw a table comparing the original data with the data given by the model.
e
Explanation of Solution
Given information:
Table:
Draw the table comparing the original data and the data given by the model.
| Original data | Data from the model | ||
| x | y | ||
| 1 | 4.0 | 1 | 3.60364 |
| 2 | 6.5 | 2 | 6.08061 |
| 3 | 8.8 | 3 | 8.55758 |
| 4 | 10.6 | 4 | 11.03455 |
| 5 | 13.9 | 5 | 13.51152 |
| 6 | 15.0 | 6 | 15.98849 |
| 7 | 17.5 | 7 | 18.46546 |
| 8 | 20.1 | 8 | 20.94243 |
| 9 | 24.0 | 9 | 23.4194 |
| 10 | 27.1 | 10 | 25.89637 |
Data from the model is obtained by substituting the values of x as
Interpretation:
When the original data and the data from the model are compared with each other, it is found that the values are nearly equal.
Chapter 2 Solutions
EP PRECALC.GRAPHING APPR.-WEBASSIGN-1YR


- Use Laplace transform to solve the initial value problem y' + y = tsin(t), y(0) = 0arrow_forwardThe function g is defined by g(x) = sec² x + tan x. What are all solutions to g(x) = 1 on the interval 0 ≤ x ≤ 2π ? A x = = 0, x == = 3, x = π, x = 7 4 , 4 and x 2π only = B x = 4' 1, x = 1, x = 57 and x = 3 only C x = πk and x = - +πk D , where is any integer П x = +πk and П x = +πk, where k is any integerarrow_forwardVector v = PQ has initial point P (2, 14) and terminal point Q (7, 3). Vector v = RS has initial point R (29, 8) and terminal point S (12, 17). Part A: Write u and v in linear form. Show all necessary work. Part B: Write u and v in trigonometric form. Show all necessary work. Part C: Find 7u − 4v. Show all necessary calculations.arrow_forward
- An object is suspended by two cables attached at a single point. The force applied on one cable has a magnitude of 125 pounds and acts at an angle of 37°. The force on the other cable is 75 pounds at an angle of 150°.Part A: Write each vector in component form. Show all necessary work.Part B: Find the dot product of the vectors. Show all necessary calculations Part C: Use the dot product to find the angle between the cables. Round the answer to the nearest degree. Show all necessary calculations.arrow_forwardAn airplane flies at 500 mph with a direction of 135° relative to the air. The plane experiences a wind that blows 60 mph with a direction of 60°.Part A: Write each of the vectors in linear form. Show all necessary calculations.Part B: Find the sum of the vectors. Show all necessary calculations. Part C: Find the true speed and direction of the airplane. Round the speed to the thousandths place and the direction to the nearest degree. Show all necessary calculations.arrow_forwardUse sigma notation to write the sum. Σ EM i=1 - n 2 4n + n narrow_forward
- Vectors t = 3i + 7j, u = 2i − 5j, and v = −21i + 9j are given.Part A: Find the angle between vectors t and u. Show all necessary calculations. Part B: Choose a value for c, such that c > 1. Find w = cv. Show all necessary work.Part C: Use the dot product to determine if t and w are parallel, orthogonal, or neither. Justify your answer.arrow_forwardA small company of science writers found that its rate of profit (in thousands of dollars) after t years of operation is given by P'(t) = (5t + 15) (t² + 6t+9) ³. (a) Find the total profit in the first three years. (b) Find the profit in the sixth year of operation. (c) What is happening to the annual profit over the long run? (a) The total profit in the first three years is $ (Round to the nearest dollar as needed.)arrow_forwardFind the area between the curves. x= -2, x = 7, y=2x² +3, y=0 Set up the integral (or integrals) needed to compute this area. Use the smallest possible number of integrals. Select the correct choice below and fill in the answer boxes to complete your choice. A. 7 [[2x² +3] dx -2 B. [[ ] dx+ -2 7 S [ ] dx The area between the curves is (Simplify your answer.)arrow_forward
- The rate at which a substance grows is given by R'(x) = 105e0.3x, where x is the time (in days). What is the total accumulated growth during the first 2.5 days? Set up the definite integral that determines the accumulated growth during the first 2.5 days. 2.5 Growth = (105e0.3x) dx 0 (Type exact answers in terms of e.) Evaluate the definite integral. Growth= (Do not round until the final answer. Then round to one decimal place as needed.)arrow_forwardFind the total area of the shaded regions. y 18- 16- 14- 12- 10- 8- 6- y=ex+1-e 4- 2- 0- 2 3 4 5 -2 -4- X ☑ The total area of the shaded regions is (Type an integer or decimal rounded to three decimal places as needed.)arrow_forwardThe graph of f(x), shown here, consists of two straight line segments and two quarter circles. Find the 19 value of f(x)dx. 小 Srxdx. 19 f(x)dx y 7 -7 2 12 19 X ☑arrow_forward
 Calculus: Early TranscendentalsCalculusISBN:9781285741550Author:James StewartPublisher:Cengage Learning
 Thomas' Calculus (14th Edition)CalculusISBN:9780134438986Author:Joel R. Hass, Christopher E. Heil, Maurice D. WeirPublisher:PEARSON
 Calculus: Early Transcendentals (3rd Edition)CalculusISBN:9780134763644Author:William L. Briggs, Lyle Cochran, Bernard Gillett, Eric SchulzPublisher:PEARSON
 Calculus: Early TranscendentalsCalculusISBN:9781319050740Author:Jon Rogawski, Colin Adams, Robert FranzosaPublisher:W. H. Freeman
 Calculus: Early Transcendental FunctionsCalculusISBN:9781337552516Author:Ron Larson, Bruce H. EdwardsPublisher:Cengage Learning