
Concept explainers
Videos
a.
To draw: a
a.
Explanation of Solution
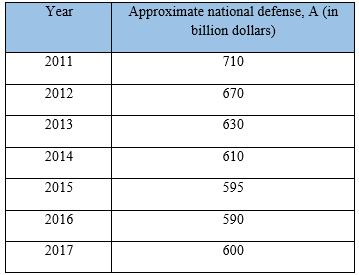
Given:

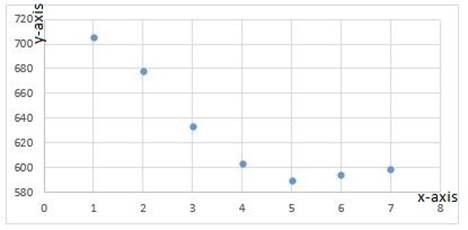
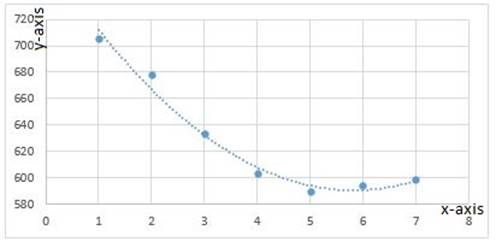
Graph:
Interpretation:
The given plot shows that the budget for national defense has decreased approximately uniformly from 2011 up to 2015 and has been almost constant from 2015 to 2017 with small variations.
b.
To find: a quadratic model for the given data.
b.
Explanation of Solution
Given:
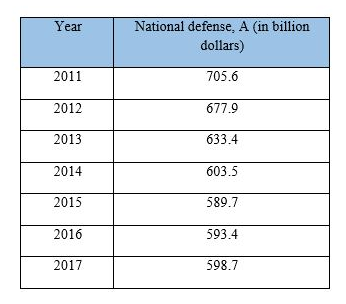
Graph:
Interpretation:
Looking at the overall movement of graph, it appears almost following the quadratic model with small variation.
The equation of the graph comes out to be 1y13y
c.
To find: a quadratic model with the scatter plot from part (a).
c.
Explanation of Solution
Given:

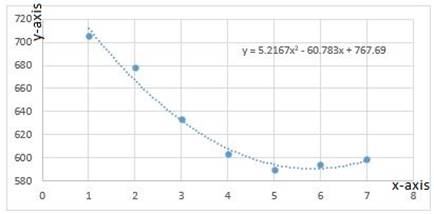
Graph:
Interpretation:
Looking at the overall movement of graph, it appears almost following the quadratic model with small variation.
d.
To find: the approximate spending on national defense each year using quadratic model of the data.
d.
Explanation of Solution
Given:

Graph:
Interpretation:
From the graph the approximate spending on national defense in each year is given in following table
Conclusion:
Comparing the approximate data from the graph with the actual data, it is observed that the variation is not more than 10 at any instant.
Though the differences are substantial at some point, the quadratic model still fits much better than any other model because of how closely it follows the data.
Further, it can also be used to predict the future movement of the curve.
e.
To compare estimated data from the quadratic model with the actual data.
e.
Explanation of Solution
Given:
The estimated data and the actual data are given in the table below.
Actual data

Estimated data.
On a close observation of the difference between the estimated data and the actual data, it seems that nowhere the difference was more than 10, which is an indication of an almost fit model for the data.
The quadratic model follows closely with the movement of actual curve.
Thus, the model is good fit for the given data.
Conclusion:
Quadratic model is good fit for the data as the difference between two values is not constant but rather changes with almost constant proportion.
Chapter 2 Solutions
EP PRECALC.GRAPHING APPR.-WEBASSIGN-1YR


- Find the effective rate corresponding to the given nominal rate. (Round your answers to three decimal places.) (a) 9.5%/year compounded monthly % (b) 9.5%/year compounded daily % Need Help? Read It Watch It SUBMIT ANSWER -/6.66 Points] DETAILS MY NOTES TANAPCALC10 5.3.007. ASK YOUR TEACHE Find the present value of $90,000 due in 7 years at the given rate of interest. (Round your answers to the nearest cent.) (a) 9%/year compounded semiannually (b) 9%/year compounded quarterly LAarrow_forwardFind the accumulated amount A, if the principal P is invested at an interest rate of r per year for t years. (Round your answer to the nearest cent.) P = $160,000, r = 7%, t = 4, compounded daily A = $211113.60 Need Help? Read It SUBMIT ANSWER ASK YOUR TEACHER PRACTICE ANOTHER --/6.66 Points] DETAILS MY NOTES TANAPCALC10 5.3.005. Find the effective rate corresponding to the given nominal rate. (Round your answers to three decimal places.) (a) 8%/year compounded semiannually % (b) 9%/year compounded quarterly %arrow_forwardFind the derivative of the function. g'(t) = 9t g(t) = In(t) (9ln(t) - 1) [In(t)] 2 × Need Help? Read It Watch Itarrow_forward
- Find the accumulated amount A, if the principal P is invested at an interest rate of r per year for t years. (Round your answer to the nearest cent.) P = $3800, r = 4%, t = 10, compounded semiannually A = $ 5645.60 × Need Help? Read It SUBMIT ANSWER [3.33/6.66 Points] DETAILS MY NOTES REVIOUS ANSWERS ASK YOUR TEACHER TANAPCALC10 5.3.001.EP. PRACTICE ANOTHER Consider the following where the principal P is invested at an interest rate of r per year for t years. P = $3,100, r = 4%, t = 10, compounded semiannually Determine m, the number of conversion periods per year. 2 Find the accumulated amount A (in dollars). (Round your answer to the nearest cent.) A = $ 4604.44arrow_forwardForce with 800 N and 400 N are acting on a machine part at 30° and 60°, respectively with a positive x axis, Draw the diagram representing this situationarrow_forwardI forgot to mention to you to solve question 1 and 2. Can you solve it using all data that given in the pict i given and can you teach me about that.arrow_forward
 Calculus: Early TranscendentalsCalculusISBN:9781285741550Author:James StewartPublisher:Cengage Learning
 Thomas' Calculus (14th Edition)CalculusISBN:9780134438986Author:Joel R. Hass, Christopher E. Heil, Maurice D. WeirPublisher:PEARSON
 Calculus: Early Transcendentals (3rd Edition)CalculusISBN:9780134763644Author:William L. Briggs, Lyle Cochran, Bernard Gillett, Eric SchulzPublisher:PEARSON
 Calculus: Early TranscendentalsCalculusISBN:9781319050740Author:Jon Rogawski, Colin Adams, Robert FranzosaPublisher:W. H. Freeman
 Calculus: Early Transcendental FunctionsCalculusISBN:9781337552516Author:Ron Larson, Bruce H. EdwardsPublisher:Cengage Learning