
Concept explainers
Videos
a
To draw
a
Explanation of Solution
Given information:
Graph:
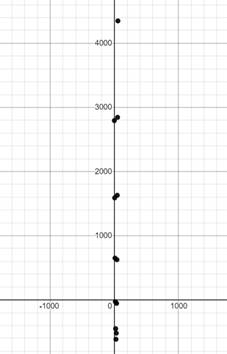
Interpretation:
Using a graphic utility, the scatter plot for the given data is shown above.
b
To find if the scatter plot could be modeled by linear model, quadratic model or neither.
b
Answer to Problem 11E
Linear model
Explanation of Solution
Given information:
To determine if the given graph can be modeled by linear model, quadratic model or neither of them, try to draw a straight line or a parabola through the given scatter plot.
If a straight line can be drawn through the points of the scatter plot, it could be modelled by linear model whereas if a parabola can be drawn through the points of the scatter plot, it could be modelled by a quadratic model.
In case if both are not possible, it could neither be modeled.
Here, in the given graph we could draw a straight line. Therefore, the scatter plot could be modeled by a linear model.
Conclusion:
Therefore, given scatter plot is modeled by linear model.
c
To find a model for the data using regression feature of a graphing utility.
c
Answer to Problem 11E
Linear model
Explanation of Solution
Given information:
Calculation:
Using the graphic utility to find the regression,
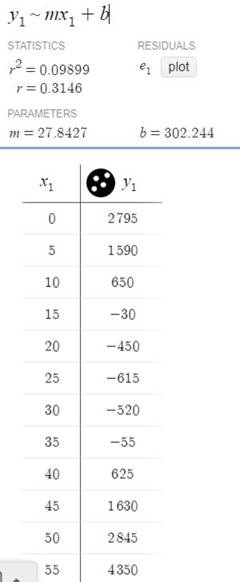
Conclusion:
Therefore, from the above figure. the regression equation for the linear model is
d
To draw the model with the scatter plot from subpart (a) using a graphic utility.
d
Explanation of Solution
Given information:
Graph:
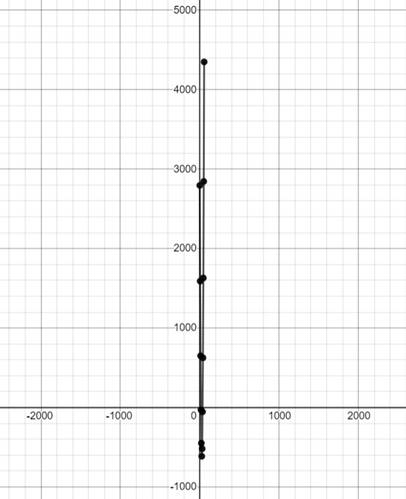
Interpretation:
Using a graphic utility, a straight line is formed when the data is kept on a graph.
e
To draw a table comparing the original data with the data given by the model.
e
Explanation of Solution
Given information:
Table:
Draw the table comparing the original data and the data given by the model.
| Original data | Data from the model | ||
| x | y | ||
| 0 | 2795 | 0 | 302.244 |
| 5 | 1590 | 5 | 441.458 |
| 10 | 650 | 10 | 580.671 |
| 15 | -30 | 15 | 719.885 |
| 20 | -450 | 20 | 859.098 |
| 25 | -615 | 25 | 998.312 |
| 30 | -520 | 30 | 1137.53 |
| 35 | -55 | 35 | 1276.74 |
| 40 | 625 | 40 | 1415.95 |
| 45 | 1630 | 45 | 1555.17 |
| 50 | 2845 | 50 | 1694.38 |
| 55 | 4350 | 55 | 302.244 |
Data from the model is obtained by substituting the values of x as
Interpretation:
When the original data and the data from the model are compared with each other, it is found that the values are nearly equal.
Chapter 2 Solutions
EP PRECALC.GRAPHING APPR.-WEBASSIGN-1YR


- Find the accumulated amount A, if the principal P is invested at an interest rate of r per year for t years. (Round your answer to the nearest cent.) P = $3800, r = 4%, t = 10, compounded semiannually A = $ 5645.60 × Need Help? Read It SUBMIT ANSWER [3.33/6.66 Points] DETAILS MY NOTES REVIOUS ANSWERS ASK YOUR TEACHER TANAPCALC10 5.3.001.EP. PRACTICE ANOTHER Consider the following where the principal P is invested at an interest rate of r per year for t years. P = $3,100, r = 4%, t = 10, compounded semiannually Determine m, the number of conversion periods per year. 2 Find the accumulated amount A (in dollars). (Round your answer to the nearest cent.) A = $ 4604.44arrow_forwardForce with 800 N and 400 N are acting on a machine part at 30° and 60°, respectively with a positive x axis, Draw the diagram representing this situationarrow_forwardI forgot to mention to you to solve question 1 and 2. Can you solve it using all data that given in the pict i given and can you teach me about that.arrow_forward
 Calculus: Early TranscendentalsCalculusISBN:9781285741550Author:James StewartPublisher:Cengage Learning
 Thomas' Calculus (14th Edition)CalculusISBN:9780134438986Author:Joel R. Hass, Christopher E. Heil, Maurice D. WeirPublisher:PEARSON
 Calculus: Early Transcendentals (3rd Edition)CalculusISBN:9780134763644Author:William L. Briggs, Lyle Cochran, Bernard Gillett, Eric SchulzPublisher:PEARSON
 Calculus: Early TranscendentalsCalculusISBN:9781319050740Author:Jon Rogawski, Colin Adams, Robert FranzosaPublisher:W. H. Freeman
 Calculus: Early Transcendental FunctionsCalculusISBN:9781337552516Author:Ron Larson, Bruce H. EdwardsPublisher:Cengage Learning