
Concept explainers
Videos
a
To draw
a
Explanation of Solution
Given information:
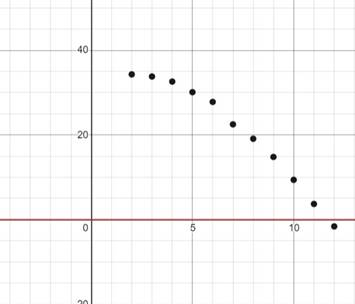
Graph:
Interpretation:
Using a graphic utility, the scatter plot for the given data is shown above.
b
To find if the scatter plot could be modeled by linear model, quadratic model or neither.
b
Answer to Problem 16E
Quadratic model
Explanation of Solution
Given information:
To determine if the given graph can be modeled by linear model, quadratic model or neither of them, try to draw a straight line or a parabola through the given scatter plot.
If a straight line can be drawn through the points of the scatter plot, it could be modelled by linear model whereas if a parabola can be drawn through the points of the scatter plot, it could be modelled by a quadratic model.
In case if both are not possible, it could neither be modeled.
Here, in the given graph we could draw a parabola opened upwards. Therefore, the scatter plot could be modeled by a quadratic model.
Conclusion:
Therefore, given scatter plot is modeled by quadratic model.
c
To find a model for the data using regression feature of a graphing utility.
c
Answer to Problem 16E
Quadratic model
Explanation of Solution
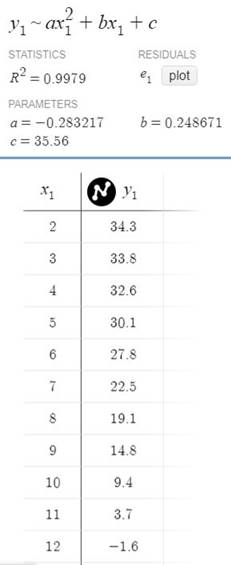
Given information:
Calculation:
Using the graphic utility to find the regression,
Conclusion:
Therefore, from the above figure. the regression equation for the quadratic model is
d
To draw the model with the scatter plot from subpart (a) using a graphic utility.
d
Explanation of Solution
Given information:
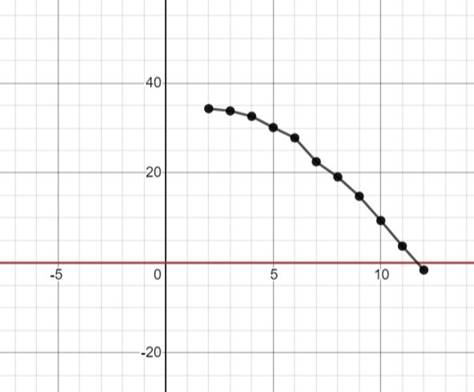
Graph:
Interpretation:
Using a graphic utility, a parabola is formed when the data is kept on a graph.
e
To draw a table comparing the original data with the data given by the model.
e
Explanation of Solution
Given information:
Table:
Draw the table comparing the original data and the data given by the model.
| Original data | Data from the model | ||
| x | y | ||
| 2 | 34.3 | 2 | 34.92447 |
| 3 | 33.8 | 3 | 33.75706 |
| 4 | 32.6 | 4 | 32.02321 |
| 5 | 30.1 | 5 | 29.72293 |
| 6 | 27.8 | 6 | 26.85621 |
| 7 | 22.5 | 7 | 23.42306 |
| 8 | 19.1 | 8 | 19.42348 |
| 9 | 14.8 | 9 | 14.85746 |
| 10 | 9.4 | 10 | 9.72501 |
| 11 | 3.7 | 11 | 4.026124 |
| 12 | -1.6 | 12 | -2.2392 |
Data from the model is obtained by substituting the values of x as
Interpretation:
When the original data and the data from the model are compared with each other, it is found that the values are nearly equal.
Chapter 2 Solutions
EP PRECALC.GRAPHING APPR.-WEBASSIGN-1YR


 Calculus: Early TranscendentalsCalculusISBN:9781285741550Author:James StewartPublisher:Cengage Learning
 Thomas' Calculus (14th Edition)CalculusISBN:9780134438986Author:Joel R. Hass, Christopher E. Heil, Maurice D. WeirPublisher:PEARSON
 Calculus: Early Transcendentals (3rd Edition)CalculusISBN:9780134763644Author:William L. Briggs, Lyle Cochran, Bernard Gillett, Eric SchulzPublisher:PEARSON
 Calculus: Early TranscendentalsCalculusISBN:9781319050740Author:Jon Rogawski, Colin Adams, Robert FranzosaPublisher:W. H. Freeman
 Calculus: Early Transcendental FunctionsCalculusISBN:9781337552516Author:Ron Larson, Bruce H. EdwardsPublisher:Cengage Learning