
Concept explainers
Videos
a.
To sketch the graph of the function by applying the leading coefficient test.
a.
Explanation of Solution
Given Information:
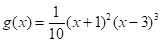
The given polynomial function is-

Calculation:
Leading coefficient test-
The graph of the polynomial function 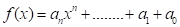 rises or falls eventually in the following way −
It depends on the value of  as
as  moves to the left or to the rightwithout bound,
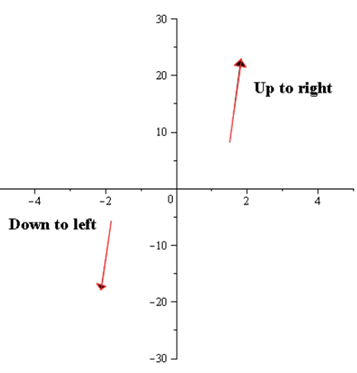
1. For positive leading coefficient is positiveand odd the graph will rise to the right and will fall to the left and otherwise for the negative leading coefficient, the graph will rise to the left and will fall to the right.
2. For positive leading coefficient and even the graph will riseto the left and right and for the negative leading coefficient, the graph will fallto the left and right.
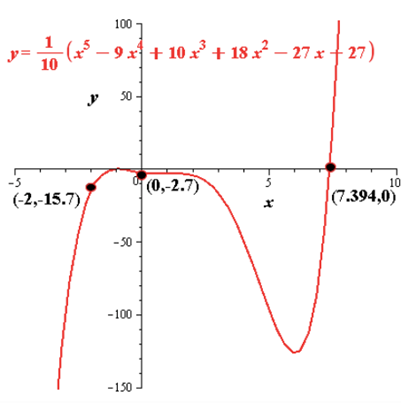
As the degree of polynomial is odd and the leading coefficient is positive, so by the leading coefficient test it can be concluded that the graph of the polynomial function will rise to the right andwill fall to the left as shown below-
b.
To sketch the graph of the function by finding the zeroes of the polynomial,
b.
Explanation of Solution
Given Information:
The given polynomial function is-

Calculation:
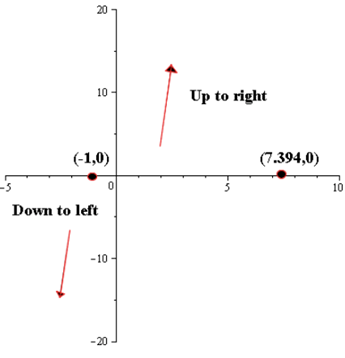
The real zeroes of the polynomial functioncan be determined by putting.
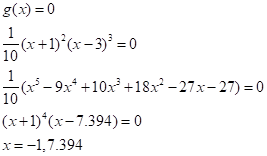
So, there are tworeal zeroes of the polynomial 
c.
To sketch the graph of the function by plotting sufficient solution points
c.
Explanation of Solution
Given Information:
The given polynomial function is-
Calculation:
The answers may vary as there are no fixed solution points.
d.
To sketch the graph of the function by drawing a continuous curve through the points.
d.
Explanation of Solution
Given Information:
The given polynomial function is-

Calculation:
The continuous plot of the polynomial function is,
Chapter 2 Solutions
EBK PRECALCULUS W/LIMITS


- f'(x)arrow_forwardA body of mass m at the top of a 100 m high tower is thrown vertically upward with an initial velocity of 10 m/s. Assume that the air resistance FD acting on the body is proportional to the velocity V, so that FD=kV. Taking g = 9.75 m/s2 and k/m = 5 s, determine: a) what height the body will reach at the top of the tower, b) how long it will take the body to touch the ground, and c) the velocity of the body when it touches the ground.arrow_forwardA chemical reaction involving the interaction of two substances A and B to form a new compound X is called a second order reaction. In such cases it is observed that the rate of reaction (or the rate at which the new compound is formed) is proportional to the product of the remaining amounts of the two original substances. If a molecule of A and a molecule of B combine to form a molecule of X (i.e., the reaction equation is A + B ⮕ X), then the differential equation describing this specific reaction can be expressed as: dx/dt = k(a-x)(b-x) where k is a positive constant, a and b are the initial concentrations of the reactants A and B, respectively, and x(t) is the concentration of the new compound at any time t. Assuming that no amount of compound X is present at the start, obtain a relationship for x(t). What happens when t ⮕∞?arrow_forwardConsider a body of mass m dropped from rest at t = 0. The body falls under the influence of gravity, and the air resistance FD opposing the motion is assumed to be proportional to the square of the velocity, so that FD = kV2. Call x the vertical distance and take the positive direction of the x-axis downward, with origin at the initial position of the body. Obtain relationships for the velocity and position of the body as a function of time t.arrow_forwardAssuming that the rate of change of the price P of a certain commodity is proportional to the difference between demand D and supply S at any time t, the differential equations describing the price fluctuations with respect to time can be expressed as: dP/dt = k(D - s) where k is the proportionality constant whose value depends on the specific commodity. Solve the above differential equation by expressing supply and demand as simply linear functions of price in the form S = aP - b and D = e - fParrow_forwardFind the area of the surface obtained by rotating the circle x² + y² = r² about the line y = r.arrow_forward1) Find the equation of the tangent line to the graph y=xe at the point (1, 1).arrow_forward3) Suppose that f is differentiable on [0, 5], and f'(x) ≤ 3 over this interval. If f(0) = −1, what is the maximum possible value of f(5)?arrow_forward2) Find the maximum value of f(x, y) = x - y on the circle x² + y² - 4x - 2y - 4 = 0.arrow_forwardFor the system consisting of the lines: and 71 = (-8,5,6) + t(4, −5,3) 72 = (0, −24,9) + u(−1, 6, −3) a) State whether the two lines are parallel or not and justify your answer. b) Find the point of intersection, if possible, and classify the system based on the number of points of intersection and how the lines are related. Show a complete solution process.arrow_forward3. [-/2 Points] DETAILS MY NOTES SESSCALCET2 7.4.013. Find the exact length of the curve. y = In(sec x), 0 ≤ x ≤ π/4arrow_forwardH.w WI M Wz A Sindax Sind dy max Утах at 0.75m from A w=6KN/M L=2 W2=9 KN/m P= 10 KN B Make the solution handwritten and not artificial intelligence because I will give a bad rating if you solve it with artificial intelligencearrow_forwardarrow_back_iosSEE MORE QUESTIONSarrow_forward_ios
 Calculus: Early TranscendentalsCalculusISBN:9781285741550Author:James StewartPublisher:Cengage Learning
 Thomas' Calculus (14th Edition)CalculusISBN:9780134438986Author:Joel R. Hass, Christopher E. Heil, Maurice D. WeirPublisher:PEARSON
 Calculus: Early Transcendentals (3rd Edition)CalculusISBN:9780134763644Author:William L. Briggs, Lyle Cochran, Bernard Gillett, Eric SchulzPublisher:PEARSON
 Calculus: Early TranscendentalsCalculusISBN:9781319050740Author:Jon Rogawski, Colin Adams, Robert FranzosaPublisher:W. H. Freeman
 Calculus: Early Transcendental FunctionsCalculusISBN:9781337552516Author:Ron Larson, Bruce H. EdwardsPublisher:Cengage Learning