
Concept explainers
Videos
(a)
The graph of the function applying the lead coefficient test.
(a)
Explanation of Solution
Given information:
The polynomial function as given below,
Formula used:
The horizontal axis represents the x- axis and the vertical axis represents the y-axis.
Calculation:
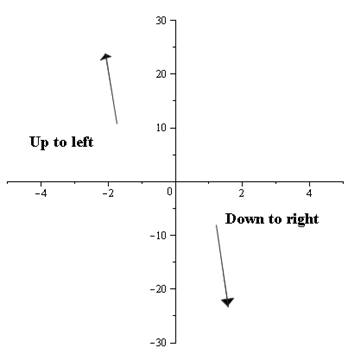
The leading coefficient test says that: 1- If the degree of the polynomial is even and the leading coefficient is positive, both ends of the graph rise up. 2. If the degree is even and the leading coefficient is negative, both ends of the graph fall down. 3- If the degree is odd and the leading coefficient is positive, the left side of the graph falls down and the right side rises up. 4. If the degree is odd and the leading coefficient is negative, the left side of the graph rises up and the right side falls down.
As the leading coefficient is negative and degree is odd, the graph rises up on the left side and falls down on the right.
The graph’s ends would be as shown below:
Conclusion:
The graph is plotted against the II and IV quadrant.
(b)
The real zeros of the polynomial.
(b)
Answer to Problem 78E
The value of x is
Explanation of Solution
Given information:
The polynomial function as given below,
Formula used:
The polynomial is equated to zero.
Calculation:
The leading coefficient test says that: 1- If the degree of the polynomial is even and the leading coefficient is positive, both ends of the graph rise up. 2. If the degree is even and the leading coefficient is negative, both ends of the graph fall down. 3- If the degree is odd and the leading coefficient is positive, the left side of the graph falls down and the right side rises up. 4. If the degree is odd and the leading coefficient is negative, the left side of the graph rises up and the right side falls down.
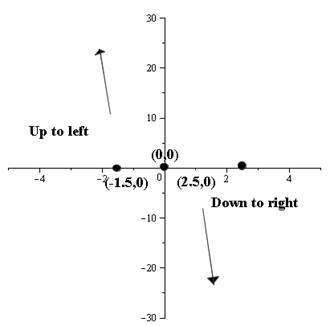
Putting
Adding these points to the graph, the graph would be as shown below,
Conclusion:
The value of x is
(c)
The plotting of sufficient solution points.
(c)
Answer to Problem 78E
The graphs get increases and decreases continuously.
Explanation of Solution
Given information:
The polynomial function as given below,
Formula used:
The horizontal axis represent the x-axis and the vertical axis represent the y-axis.
Calculation:
The leading coefficient test says that: 1- If the degree of the polynomial is even and the leading coefficient is positive, both ends of the graph rise up. 2. If the degree is even and the leading coefficient is negative, both ends of the graph fall down. 3- If the degree is odd and the leading coefficient is positive, the left side of the graph falls down and the right side rises up. 4. If the degree is odd and the leading coefficient is negative, the left side of the graph rises up and the right side falls down.
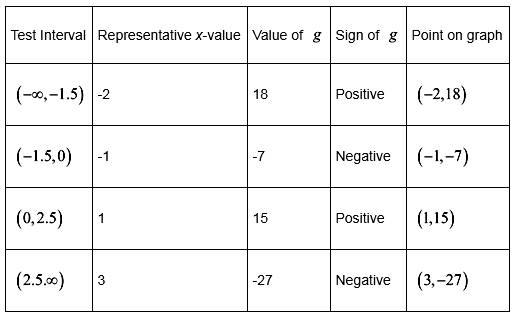
The polynomial function is evaluated at the values chosen between the test intervals. And the test interval is determined by the values of the zeros. Consider the table of values shown below:
Conclusion:
The graphs get increases and decreases continuously.
(d)
The continuous curve through the points.
(d)
Answer to Problem 78E
The graph cuts the x-axis at
Explanation of Solution
Given information:
The polynomial function as given below,
Formula used:
The zeros are of odd multiplicity
Calculation:
The leading coefficient test says that: 1- If the degree of the polynomial is even and the leading coefficient is positive, both ends of the graph rise up. 2. If the degree is even and the leading coefficient is negative, both ends of the graph fall down. 3- If the degree is odd and the leading coefficient is positive, the left side of the graph falls down and the right side rises up. 4. If the degree is odd and the leading coefficient is negative, the left side of the graph rises up and the right side falls down.
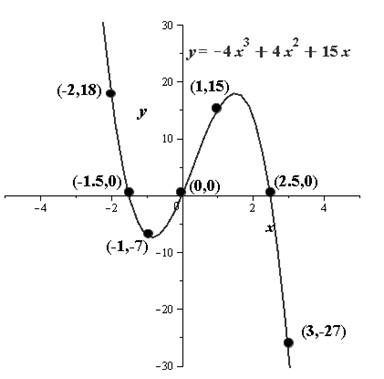
A continuous curve through the points obtained in the table is drawn. It is to be noted that as all the zeros are of odd multiplicity, the graph cuts the x-axis at
The graph is as shown below:
Conclusion:
The graph cuts the x-axis at
Chapter 2 Solutions
EBK PRECALCULUS W/LIMITS


- question 3 part a and barrow_forwarddo question 2arrow_forwardf'(x)arrow_forwardA body of mass m at the top of a 100 m high tower is thrown vertically upward with an initial velocity of 10 m/s. Assume that the air resistance FD acting on the body is proportional to the velocity V, so that FD=kV. Taking g = 9.75 m/s2 and k/m = 5 s, determine: a) what height the body will reach at the top of the tower, b) how long it will take the body to touch the ground, and c) the velocity of the body when it touches the ground.arrow_forwardA chemical reaction involving the interaction of two substances A and B to form a new compound X is called a second order reaction. In such cases it is observed that the rate of reaction (or the rate at which the new compound is formed) is proportional to the product of the remaining amounts of the two original substances. If a molecule of A and a molecule of B combine to form a molecule of X (i.e., the reaction equation is A + B ⮕ X), then the differential equation describing this specific reaction can be expressed as: dx/dt = k(a-x)(b-x) where k is a positive constant, a and b are the initial concentrations of the reactants A and B, respectively, and x(t) is the concentration of the new compound at any time t. Assuming that no amount of compound X is present at the start, obtain a relationship for x(t). What happens when t ⮕∞?arrow_forwardConsider a body of mass m dropped from rest at t = 0. The body falls under the influence of gravity, and the air resistance FD opposing the motion is assumed to be proportional to the square of the velocity, so that FD = kV2. Call x the vertical distance and take the positive direction of the x-axis downward, with origin at the initial position of the body. Obtain relationships for the velocity and position of the body as a function of time t.arrow_forwardAssuming that the rate of change of the price P of a certain commodity is proportional to the difference between demand D and supply S at any time t, the differential equations describing the price fluctuations with respect to time can be expressed as: dP/dt = k(D - s) where k is the proportionality constant whose value depends on the specific commodity. Solve the above differential equation by expressing supply and demand as simply linear functions of price in the form S = aP - b and D = e - fParrow_forwardFind the area of the surface obtained by rotating the circle x² + y² = r² about the line y = r.arrow_forward1) Find the equation of the tangent line to the graph y=xe at the point (1, 1).arrow_forwardarrow_back_iosSEE MORE QUESTIONSarrow_forward_ios
 Calculus: Early TranscendentalsCalculusISBN:9781285741550Author:James StewartPublisher:Cengage Learning
 Thomas' Calculus (14th Edition)CalculusISBN:9780134438986Author:Joel R. Hass, Christopher E. Heil, Maurice D. WeirPublisher:PEARSON
 Calculus: Early Transcendentals (3rd Edition)CalculusISBN:9780134763644Author:William L. Briggs, Lyle Cochran, Bernard Gillett, Eric SchulzPublisher:PEARSON
 Calculus: Early TranscendentalsCalculusISBN:9781319050740Author:Jon Rogawski, Colin Adams, Robert FranzosaPublisher:W. H. Freeman
 Calculus: Early Transcendental FunctionsCalculusISBN:9781337552516Author:Ron Larson, Bruce H. EdwardsPublisher:Cengage Learning