
Concept explainers
Videos
a.
Use the regression feature of a graphing utility to find a quadratic model for the data.
a.
Answer to Problem 12PS
Explanation of Solution
Calculation:
Consider the following table;
Use graphing utility Ti-83 to create the
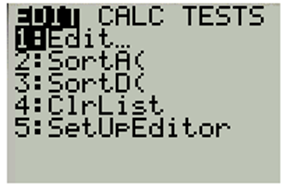
Go to STAT and select EDIT
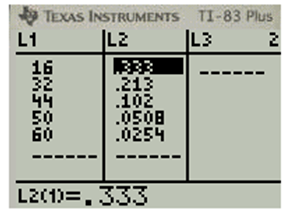
Then enter the data in the L1 as year and L2 as sales in that list. The list look like below:
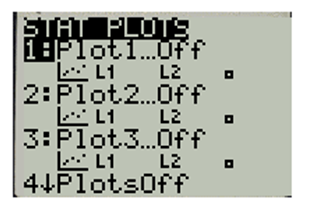
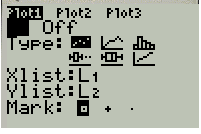
Now, go to the STAT PLOT and choose Plot1.......Off.
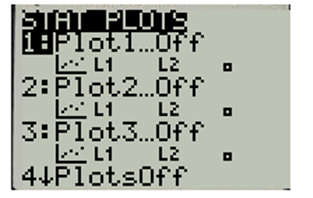
Now, ENTER and turn ON Plot-1
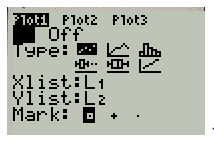
Select the first type of Plot and turn off the other types.
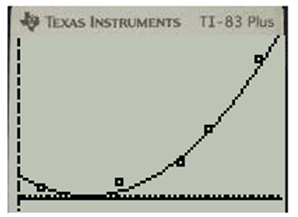
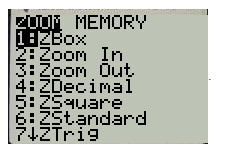
Now, go to ZOOM option and choose ZOOMSTAT:
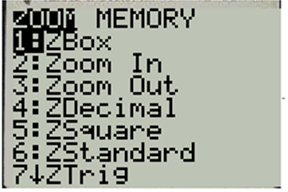
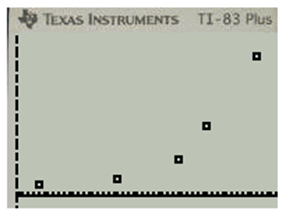
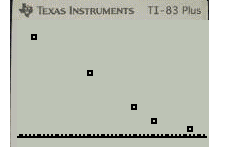
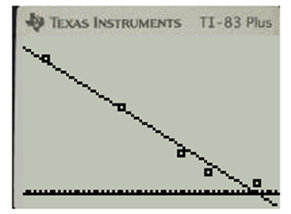
Put ENTER and you will get the plot as below:
Use regression option and find the quadratic regression for the data:
Then again go to the STAT option and go to CALC option.
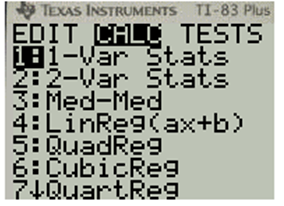
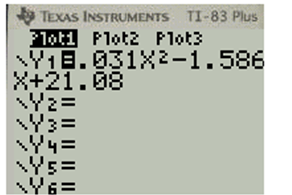
Then go to the QuadReg option, thyen go to VARS option and then Function-
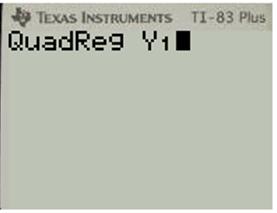
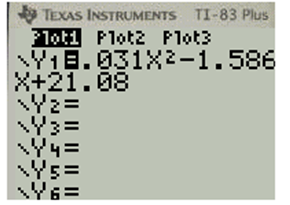
Then put ENTER. You will get the equation as below:
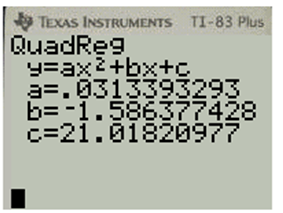
Hence, the
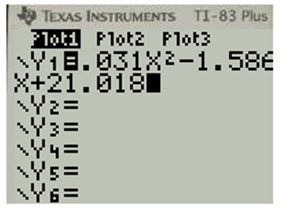
Now, graph the model in same viewing model. So, go the
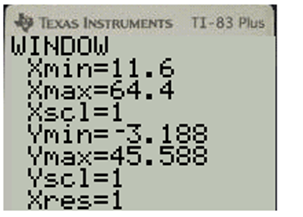
Now, do not change the WINDOW as the window is already adjusted to the scattered plot. So,
You will get the WINDOW as:
Now, go to GRAPH option and you will get the plot as:

Hence, now you can see that it almost goes with the scattered plot. So, it fit the data well.
b.
Use the graphing utility to plot the data and graph the model in the same viewing window.
b.
Answer to Problem 12PS

Explanation of Solution
Calculation:
Consider the following table;
Find the rational model of the data. So, the rational model will be as below:
Here
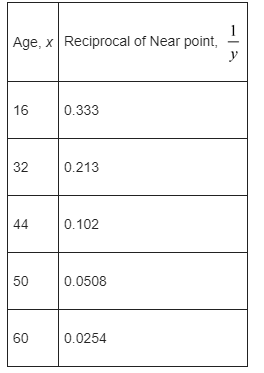
Now, consider
So, the reciprocal of
So, the new table is:
Use graphing utility Ti-83 to create the scatter plot.
Go to STAT and select EDIT.
Then enter the data in the L1 as year and L2 as sales in that list. The list will look like below:
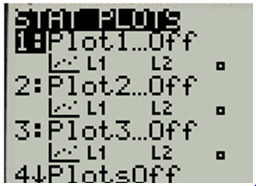
Now, go to the STAT PLOT and choose Plot1...Off.
Now, ENTER and turn ON Plot-1
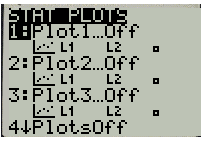
Select the first type of plot and turn off the other types.
Now, go to the Zoom option and choose ZOOMSTAT
Put ENTER and you will get the plot as below:
Now, use regression option and find the linear regression for the data:
Then again go to the STAT option and go to CALC option.
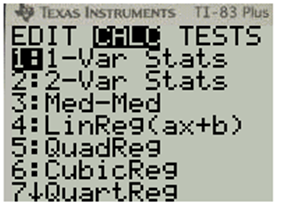
Then go to the LinReg(ax+b)option, then go VARS option and then Function-
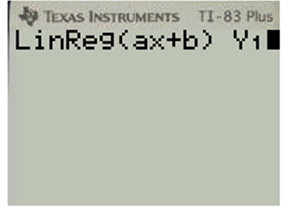
Then put ENTER. You will get the equation as below:
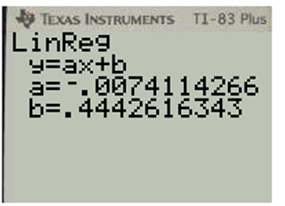
So, the rational equation is :
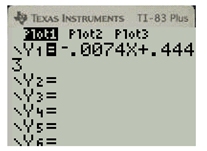
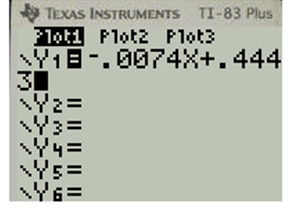
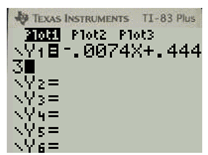
Now, graph the model in the same viewing model. So, go to the Y= option and pit the function as below:
Now, do not change the WINDOW as the window is already adjusted to the scattered plot. So, you will get the WINDOW as:
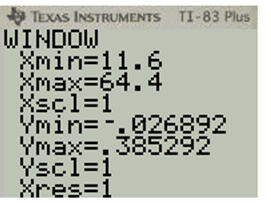
Now, go to GRAPH option and you will get the plot as:
Hence, now you can see that it almost goes with the scattered plot. So, it fit the data well.
c.
Verify that the model fit the data.
c.
Answer to Problem 12PS
The data match the quadratic model.
Explanation of Solution
Calculation:
Consider the quadratic model
Go to the TABLE option of this and get the table as:
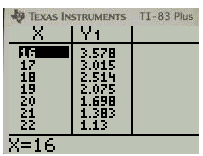
Now, from the table get the values as
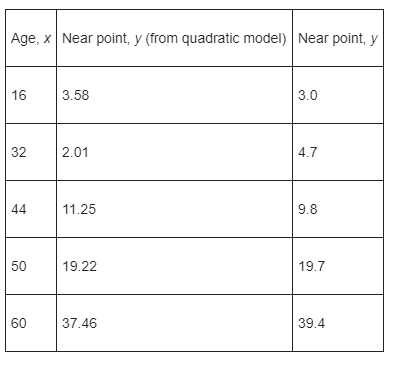
Hence, here at lower age, the data matches the rational model at the higher age, the data match the quadratic model.
d.
Use both models to estimate the near point for a person
d.
Answer to Problem 12PS
Explanation of Solution
Calculation:
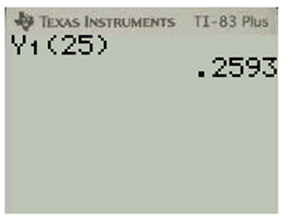
Consider the quadratic model:
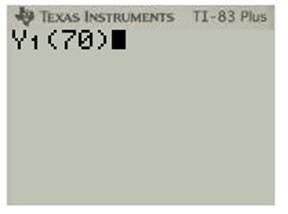
Find the near point of the person who is
Now, go to QUIT option. Then go to VARS option and then Function-
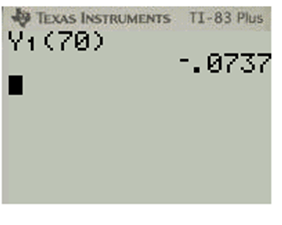
Put ENTER and you will get:
Hence, according model, the near point is at
Consider the rational model
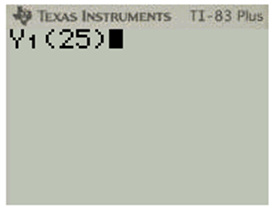
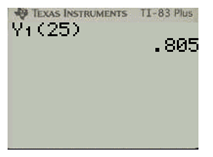
Find the near point of the person who is
Now, go to QUIT option. Then go to VARS option and then Function-
Put ENTER and you will get:
So, you get:
Hence, according to rational model, the near point is at
Predict the near point for a person
Answer to Problem 12PS
Only Quadratic model will fit at the age of
Explanation of Solution
Calculation:
Consider the quadratic model:
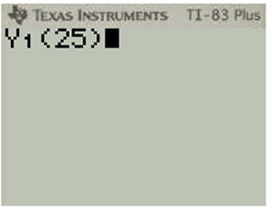
Find the near point of the person who is
Now, go to QUIT option. Then go to VARS option and then Function-
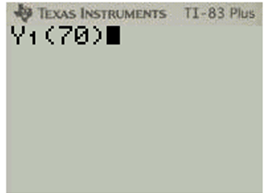
Put ENTER and you will get
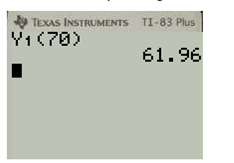
Hence, according to quadratic model, the near point is at
Consider the rational model
Find the near point of the person who is
Now, go to QUIT option. Then go to VARS option and then Function-
Put ENTER and you will get
This is absurd.
Hence, only quadratic will fit at the age of
Chapter 2 Solutions
EBK PRECALCULUS W/LIMITS


- Which of the following is the general solution to y′′ + 4y = e^2t + 12 sin(2t) ?A. y(t) = c1 cos(2t) + c2 sin(2t) + 1/8 e^2t − 3t cos(2t)B. y(t) = c1e^2t + c2e^−2t + 1/4 te^2t − 3t cos(2t)C. y(t) = c1 + c2e^−4t + 1/12 te^2t − 3t cos(2t)D. y(t) = c1 cos(2t) + c2 sin(2t) + 1/8 e^2t + 3 sin(2t)E. None of the above. Please include all steps! Thank you!arrow_forwardShow that i cote +1 = cosec 20 tan 20+1 = sec² O २ cos² + sin 20 = 1 using pythagon's theoremarrow_forwardFind the general solution to the differential equationarrow_forward
- charity savings Budget for May travel food Peter earned $700 during May. The graph shows how the money was used. What fraction was clothes? O Search Submit clothes leisurearrow_forwardExercise 11.3 A slope field is given for the equation y' = 4y+4. (a) Sketch the particular solution that corresponds to y(0) = −2 (b) Find the constant solution (c) For what initial conditions y(0) is the solution increasing? (d) For what initial conditions y(0) is the solution decreasing? (e) Verify these results using only the differential equation y' = 4y+4.arrow_forwardAphids are discovered in a pear orchard. The Department of Agriculture has determined that the population of aphids t hours after the orchard has been sprayed is approximated by N(t)=1800−3tln(0.17t)+t where 0<t≤1000. Step 1 of 2: Find N(63). Round to the nearest whole number.arrow_forward
- 3. [-/3 Points] DETAILS MY NOTES SCALCET8 7.4.032. ASK YOUR TEACHER PRACTICE ANOTHER Evaluate the integral. X + 4x + 13 Need Help? Read It SUBMIT ANSWER dxarrow_forwardEvaluate the limit, and show your answer to 4 decimals if necessary. Iz² - y²z lim (x,y,z)>(9,6,4) xyz 1 -arrow_forwardlim (x,y) (1,1) 16x18 - 16y18 429-4y⁹arrow_forward
- Evaluate the limit along the stated paths, or type "DNE" if the limit Does Not Exist: lim xy+y³ (x,y)(0,0) x²+ y² Along the path = = 0: Along the path y = = 0: Along the path y = 2x:arrow_forwardshow workarrow_forwardA graph of the function f is given below: Study the graph of ƒ at the value given below. Select each of the following that applies for the value a = 1 Of is defined at a. If is not defined at x = a. Of is continuous at x = a. If is discontinuous at x = a. Of is smooth at x = a. Of is not smooth at = a. If has a horizontal tangent line at = a. f has a vertical tangent line at x = a. Of has a oblique/slanted tangent line at x = a. If has no tangent line at x = a. f(a + h) - f(a) lim is finite. h→0 h f(a + h) - f(a) lim h->0+ and lim h h->0- f(a + h) - f(a) h are infinite. lim does not exist. h→0 f(a+h) - f(a) h f'(a) is defined. f'(a) is undefined. If is differentiable at x = a. If is not differentiable at x = a.arrow_forward
 Calculus: Early TranscendentalsCalculusISBN:9781285741550Author:James StewartPublisher:Cengage Learning
 Thomas' Calculus (14th Edition)CalculusISBN:9780134438986Author:Joel R. Hass, Christopher E. Heil, Maurice D. WeirPublisher:PEARSON
 Calculus: Early Transcendentals (3rd Edition)CalculusISBN:9780134763644Author:William L. Briggs, Lyle Cochran, Bernard Gillett, Eric SchulzPublisher:PEARSON
 Calculus: Early TranscendentalsCalculusISBN:9781319050740Author:Jon Rogawski, Colin Adams, Robert FranzosaPublisher:W. H. Freeman
 Calculus: Early Transcendental FunctionsCalculusISBN:9781337552516Author:Ron Larson, Bruce H. EdwardsPublisher:Cengage Learning