
Concept explainers
Videos
a.
To find: The
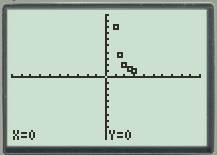
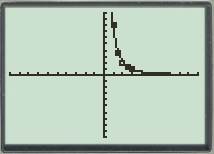
The scatter plot of the data is shown below.

Given:
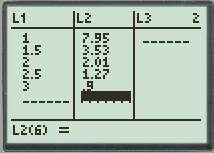
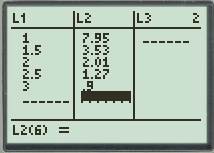
The data is as shown below.
| Distance | Intensity |
Calculation:
Press the

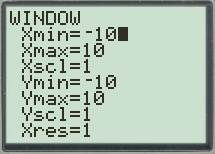
Set up the graphing window.
Press the
b.
To find: The power regression model of the data and is the value of
The power regression model of the data is
Given:
The data is as shown below.
| Distance | Intensity |
Calculation:
Press the
Set up the graphing window.

Press the STAT button and press the CALC button and select power regression for the model.
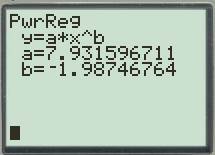
Conclusion:
The power regression model is
c.
To find: The graph of regression model and scatter plot on the same graph.
The scatter plot and the regression model is shown below.
Given:
The data is as shown below.
| Distance | Intensity |
Calculation:
Press the

Set up the graphing window.

Press the

d.
To find: The value given in the question and the calculated value is same or not.
For the distance
Given:
The data is as shown below.
| Distance | Intensity |
The value of distance is
Calculation:
Press the
Set up the graphing window.

Press the STAT button and press the CALC button and select power regression for the model.

The power regression model is
Substitute
Substitute
Conclusion:
For the distance
Chapter 2 Solutions
PRECALCULUS:GRAPHICAL,...-NASTA ED.


- Consider the region below f(x) = (11-x), above the x-axis, and between x = 0 and x = 11. Let x; be the midpoint of the ith subinterval. Complete parts a. and b. below. a. Approximate the area of the region using eleven rectangles. Use the midpoints of each subinterval for the heights of the rectangles. The area is approximately square units. (Type an integer or decimal.)arrow_forwardRama/Shutterstock.com Romaset/Shutterstock.com The power station has three different hydroelectric turbines, each with a known (and unique) power function that gives the amount of electric power generated as a function of the water flow arriving at the turbine. The incoming water can be apportioned in different volumes to each turbine, so the goal of this project is to determine how to distribute water among the turbines to give the maximum total energy production for any rate of flow. Using experimental evidence and Bernoulli's equation, the following quadratic models were determined for the power output of each turbine, along with the allowable flows of operation: 6 KW₁ = (-18.89 +0.1277Q1-4.08.10 Q) (170 - 1.6 · 10¯*Q) KW2 = (-24.51 +0.1358Q2-4.69-10 Q¹²) (170 — 1.6 · 10¯*Q) KW3 = (-27.02 +0.1380Q3 -3.84-10-5Q) (170 - 1.6-10-ºQ) where 250 Q1 <1110, 250 Q2 <1110, 250 <3 < 1225 Qi = flow through turbine i in cubic feet per second KW = power generated by turbine i in kilowattsarrow_forwardHello! Please solve this practice problem step by step thanks!arrow_forward
- Hello, I would like step by step solution on this practive problem please and thanks!arrow_forwardHello! Please Solve this Practice Problem Step by Step thanks!arrow_forwarduestion 10 of 12 A Your answer is incorrect. L 0/1 E This problem concerns hybrid cars such as the Toyota Prius that are powered by a gas-engine, electric-motor combination, but can also function in Electric-Vehicle (EV) only mode. The figure below shows the velocity, v, of a 2010 Prius Plug-in Hybrid Prototype operating in normal hybrid mode and EV-only mode, respectively, while accelerating from a stoplight. 1 80 (mph) Normal hybrid- 40 EV-only t (sec) 5 15 25 Assume two identical cars, one running in normal hybrid mode and one running in EV-only mode, accelerate together in a straight path from a stoplight. Approximately how far apart are the cars after 15 seconds? Round your answer to the nearest integer. The cars are 1 feet apart after 15 seconds. Q Search M 34 mlp CHarrow_forward
- Find the volume of the region under the surface z = xy² and above the area bounded by x = y² and x-2y= 8. Round your answer to four decimal places.arrow_forwardУ Suppose that f(x, y) = · at which {(x, y) | 0≤ x ≤ 2,-x≤ y ≤√x}. 1+x D Q Then the double integral of f(x, y) over D is || | f(x, y)dxdy = | Round your answer to four decimal places.arrow_forwardD The region D above can be describe in two ways. 1. If we visualize the region having "top" and "bottom" boundaries, express each as functions of and provide the interval of x-values that covers the entire region. "top" boundary 92(x) = | "bottom" boundary 91(x) = interval of values that covers the region = 2. If we visualize the region having "right" and "left" boundaries, express each as functions of y and provide the interval of y-values that covers the entire region. "right" boundary f2(y) = | "left" boundary fi(y) =| interval of y values that covers the region =arrow_forward
- Find the volume of the region under the surface z = corners (0,0,0), (2,0,0) and (0,5, 0). Round your answer to one decimal place. 5x5 and above the triangle in the xy-plane witharrow_forwardGiven y = 4x and y = x² +3, describe the region for Type I and Type II. Type I 8. y + 2 -24 -1 1 2 2.5 X Type II N 1.5- x 1- 0.5 -0.5 -1 1 m y -2> 3 10arrow_forwardGiven D = {(x, y) | O≤x≤2, ½ ≤y≤1 } and f(x, y) = xy then evaluate f(x, y)d using the Type II technique. 1.2 1.0 0.8 y 0.6 0.4 0.2 0- -0.2 0 0.5 1 1.5 2 X X This plot is an example of the function over region D. The region identified in your problem will be slightly different. y upper integration limit Integral Valuearrow_forward
 Calculus: Early TranscendentalsCalculusISBN:9781285741550Author:James StewartPublisher:Cengage Learning
 Thomas' Calculus (14th Edition)CalculusISBN:9780134438986Author:Joel R. Hass, Christopher E. Heil, Maurice D. WeirPublisher:PEARSON
 Calculus: Early Transcendentals (3rd Edition)CalculusISBN:9780134763644Author:William L. Briggs, Lyle Cochran, Bernard Gillett, Eric SchulzPublisher:PEARSON
 Calculus: Early TranscendentalsCalculusISBN:9781319050740Author:Jon Rogawski, Colin Adams, Robert FranzosaPublisher:W. H. Freeman
 Calculus: Early Transcendental FunctionsCalculusISBN:9781337552516Author:Ron Larson, Bruce H. EdwardsPublisher:Cengage Learning