Concept explainers
(a)
To find: The linear regression model and scatter graph.
The model of the given data
Given information
The table for the given data is below.
| period | 2 | 7 | 12 | 17 | 22 | 27 | 32 | 37 | 42 | 47 | 52 | 57 | 62 |
| temperature | 57.15 | 57.16 | 57.18 | 57.16 | 57.20 | 57.26 | 57.44 | 57.47 | 57.53 | 57.67 | 57.75 | 57.83 | 57.87 |
For 1952,x=2
Straight line equation is y=a+bx.
The normal equations are
∑y=an+b∑x
∑xy=a∑x+b∑x2
The values are calculated using the following table
| x | y | x2 | x·y |
| 2 | 57.15 | 4 | 114.3 |
| 7 | 57.16 | 49 | 400.12 |
| 12 | 57.18 | 144 | 686.16 |
| 17 | 57.16 | 289 | 971.72 |
| 22 | 57.2 | 484 | 1258.4 |
| 27 | 57.26 | 729 | 1546.02 |
| 32 | 57.44 | 1024 | 1838.08 |
| 37 | 57.47 | 1369 | 2126.39 |
| 42 | 57.53 | 1764 | 2416.26 |
| 47 | 57.67 | 2209 | 2710.49 |
| 52 | 57.75 | 2704 | 3003 |
| 57 | 57.83 | 3249 | 3296.31 |
| 62 | 57.87 | 3844 | 3587.94 |
| --- | --- | --- | --- |
| ∑x=416 | ∑y=746.67 | ∑x2=17862 | ∑x·y=23955.19 |
Substituting these values in the normal equations
13a+416b=746.67
416a+17862b=23955.19
Solving these two equations using Elimination method,
13a+416b=746.67
and 416a+17862b=23955.19
13a+416b=746.67 →(1)
416a+17862b=23955.19 →(2)
equation(1)×32⇒416a+13312b=23893.44
equation(2)×1⇒416a+17862b=23955.19
Substracting ⇒-4550b=-61.75
⇒4550b=61.75
⇒b=61.754550
⇒b=0.0136
Putting b=0.0136 in equation (1), we have
13a+416(0.0136)=746.67
⇒13a=746.67-5.6457
⇒13a=741.0243
⇒a=741.024313
⇒a=57.0019
∴a=57.0019 and b=0.0136
Now substituting this values in the equation is y=a+bx, we get
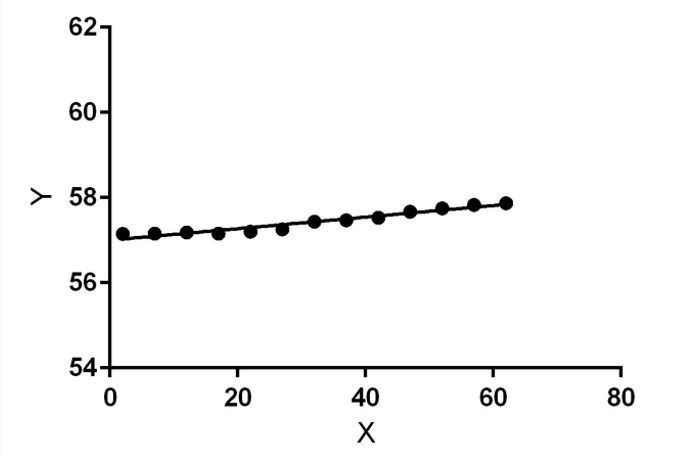
The scatter graph of above data is below.

(b)
To find: The quadratic regression model and scatter graph.
The model of the given data
Given information
The table for the given data is below.
| period | 2 | 7 | 12 | 17 | 22 | 27 | 32 | 37 | 42 | 47 | 52 | 57 | 62 |
| temperature | 57.15 | 57.16 | 57.18 | 57.16 | 57.20 | 57.26 | 57.44 | 57.47 | 57.53 | 57.67 | 57.75 | 57.83 | 57.87 |
The equation is y=a+bx+cx2 and the normal equations are
The values are calculated using the following table
| x | y | x2 | x3 | x4 | x·y | x2·y |
| 2 | 57.15 | 4 | 8 | 16 | 114.3 | 228.6 |
| 7 | 57.16 | 49 | 343 | 2401 | 400.12 | 2800.84 |
| 12 | 57.18 | 144 | 1728 | 20736 | 686.16 | 8233.92 |
| 17 | 57.16 | 289 | 4913 | 83521 | 971.72 | 16519.24 |
| 22 | 57.2 | 484 | 10648 | 234256 | 1258.4 | 27684.8 |
| 27 | 57.26 | 729 | 19683 | 531441 | 1546.02 | 41742.54 |
| 32 | 57.44 | 1024 | 32768 | 1048576 | 1838.08 | 58818.56 |
| 37 | 57.47 | 1369 | 50653 | 1874161 | 2126.39 | 78676.43 |
| 42 | 57.53 | 1764 | 74088 | 3111696 | 2416.26 | 101482.92 |
| 47 | 57.67 | 2209 | 103823 | 4879681 | 2710.49 | 127393.03 |
| 52 | 57.75 | 2704 | 140608 | 7311616 | 3003 | 156156 |
| 57 | 57.83 | 3249 | 185193 | 10556001 | 3296.31 | 187889.67 |
| 62 | 57.87 | 3844 | 238328 | 14776336 | 3587.94 | 222452.28 |
| --- | --- | --- | --- | --- | --- | --- |
| ∑x=416 | ∑y=746.67 | ∑x·y=23955.19 |
Substituting these values in the normal equations
13a+416b+17862c=746.67
416a+17862b+862784c=23955.19
17862a+862784b+44430438c=1030078.83
Solving these 3 equations,
Total Equations are 3
13a+416b+17862c=746.67→(1)
416a+17862b+862784c=23955.19→(2)
17862a+862784b+44430438c=1030078.83→(3)
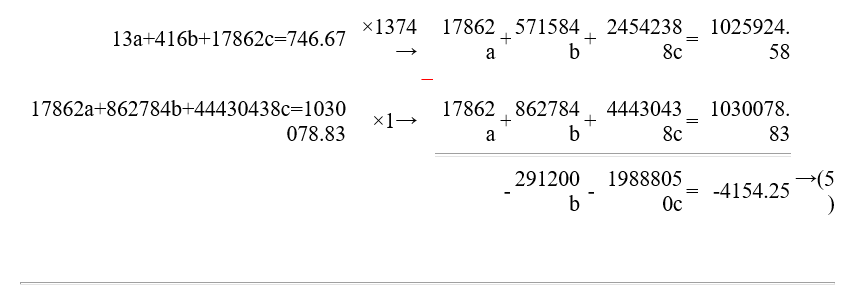
Select the equations (1) and (2), and eliminate the variable a.

Select the equations (1) and (3), and eliminate the variable a.

Select the equations (4) and (5), and eliminate the variable b.

Now use back substitution method
From (6)
1251250c=202.25
⇒c=202.251251250=0.0002
From (4)
-4550b-291200c=-61.75
⇒-4550b-291200(0.0002)=-61.75
⇒-4550b-47.0691=-61.75
⇒-4550b=-61.75+47.0691=-14.6809
⇒b=-14.6809-4550=0.0032
From (1)
13a+416b+17862c=746.67
⇒13a+416(0.0032)+17862(0.0002)=746.67
⇒13a+4.2294=746.67
⇒13a=746.67-4.2294=742.4406
⇒a=742.440613=57.1108
Solution using Elimination method.
a=57.1108,b=0.0032,c=0.0002
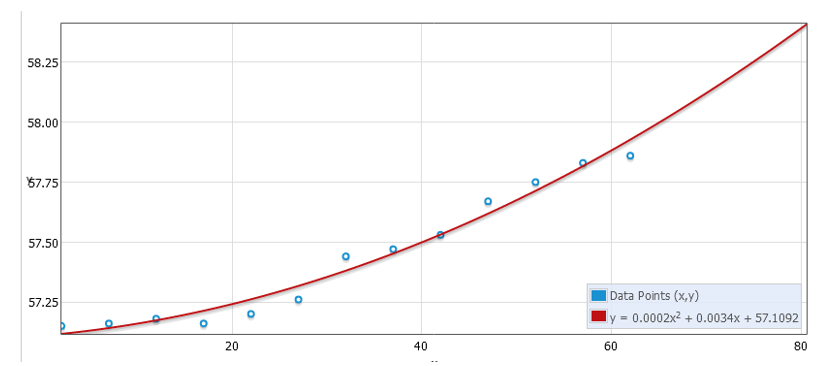
Now substituting this values in the equation is y=a+bx+cx2, we get
Scatter graph of the above data is given below

(c)
To find: Which model is best fit.
The quadratic model of the given data is best fit.
Given information
The quadratic model of the given data is best fit.
By observing the both graph it is seen that the data is more scatter to the quadratic graph and gives clear idea about how temperature goes up and down .Hence the quadratic model is best fit for the above data.
Chapter 2 Solutions
PRECALCULUS:GRAPHICAL,...-NASTA ED.
 Calculus: Early TranscendentalsCalculusISBN:9781285741550Author:James StewartPublisher:Cengage Learning
 Thomas' Calculus (14th Edition)CalculusISBN:9780134438986Author:Joel R. Hass, Christopher E. Heil, Maurice D. WeirPublisher:PEARSON
 Calculus: Early Transcendentals (3rd Edition)CalculusISBN:9780134763644Author:William L. Briggs, Lyle Cochran, Bernard Gillett, Eric SchulzPublisher:PEARSON
 Calculus: Early TranscendentalsCalculusISBN:9781319050740Author:Jon Rogawski, Colin Adams, Robert FranzosaPublisher:W. H. Freeman
 Calculus: Early Transcendental FunctionsCalculusISBN:9781337552516Author:Ron Larson, Bruce H. EdwardsPublisher:Cengage Learning


