
Concept explainers
Videos
To Describe:
The strength, and the direction of the
Moderate
Given:
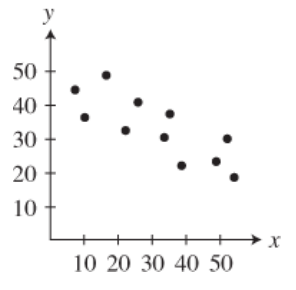
The scatter plot of a data set:
Concepts Used:
When points on the scatter plot of a dataset are clustered along a straight line, then the data is said to have linear correlation.
The collective nearness of these points to a single straight line indicates the strength of linear correlation. This can be estimated by the width of an oval enclosing all the points tilted along the said straight line. The larger the width, the lesser is the strength of the linear correlation.
If the value of
Calculations:
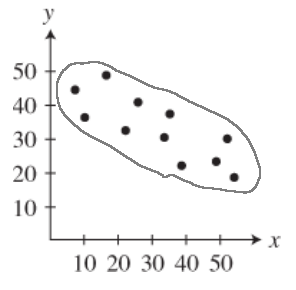
Draw an oval enclosing the points on the data.
Interpretation:
The oval enclosing the points is tilted along a straight line, indicating linear correlation.
The oval‘s width is about one third of its length. Thus, the strength of correlation is moderate.
The oval is tilted along a line with negative slope, thus the direction of linear correlation is negative.
Conclusion:
The given scatter plot represent a data set with moderate negative linear correlation.
Chapter 2 Solutions
PRECALCULUS:GRAPHICAL,...-NASTA ED.


- Pls help ASAParrow_forward9. a) Determie values of a and b so that the function is continuous. ax - 2b f(x) 2 x≤-2 -2x+a, x ≥2 \-ax² - bx + 1, −2 < x < 2) 9b) Consider f(x): = 2x²+x-3 x-b and determine all the values of b such that f(x) does not have a vertical asymptote. Show work.arrow_forwardPls help ASAParrow_forward
- 3. True False. If false create functions that prove it is false. Note: f(x) = g(x). a) If_lim ƒ(x) = ∞ and_lim g(x) = ∞,then_lim [ƒ(x) − g(x)] = 0 x→ 0+ x→0+ x→0+ b) If h(x) and g(x) are continuous at x = c, and if h(c) > 0 and g(c) = 0, then h(x) lim. will = x→c g(x) c) If lim f(x) = 0 and lim g(x) = 0 then lim f(x) does not exist. x-a x-a x→a g(x)arrow_forwardPls help ASAParrow_forward15. a) Consider f(x) = x-1 3x+2 and use the difference quotient to determine the simplified expression in terms of x, for the slope of any tangent to y = f(x). Also, determine the slope at x = 2. 15 b) Determine the equation of the tangent to f(x) at x = 2. Final answer in Standard Form Ax + By + C = 0, A ≥ 0, with no fractions or decimals.arrow_forward
 Calculus: Early TranscendentalsCalculusISBN:9781285741550Author:James StewartPublisher:Cengage Learning
 Thomas' Calculus (14th Edition)CalculusISBN:9780134438986Author:Joel R. Hass, Christopher E. Heil, Maurice D. WeirPublisher:PEARSON
 Calculus: Early Transcendentals (3rd Edition)CalculusISBN:9780134763644Author:William L. Briggs, Lyle Cochran, Bernard Gillett, Eric SchulzPublisher:PEARSON
 Calculus: Early TranscendentalsCalculusISBN:9781319050740Author:Jon Rogawski, Colin Adams, Robert FranzosaPublisher:W. H. Freeman
 Calculus: Early Transcendental FunctionsCalculusISBN:9781337552516Author:Ron Larson, Bruce H. EdwardsPublisher:Cengage Learning