
Concept explainers
Videos
a.
To draw : a
a.
Explanation of Solution
Given information :
the set of data
figure : Now plot the each point in a coordinate plane as shown in the figure.
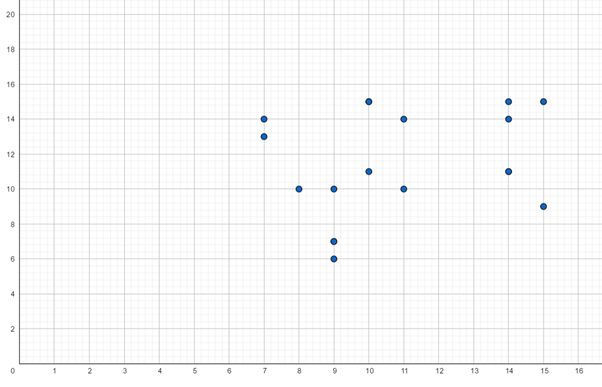
Interpretation: from the figure it can be observed that the data does not appear linear.
b.
To state : that the relationship between x and y appear to be approximately linear.
b.
Answer to Problem 6E
No, the data does not appear linear.
Explanation of Solution
Given information :
the set of data
from the data and its scatter plot it can be observed that the data does not appear linear because in the set of data the difference of x value either increase rapidly or decrease rapidly.
Chapter 1 Solutions
PRECALCULUS W/LIMITS:GRAPH.APPROACH(HS)


- Can you help explain what I did based on partial fractions decomposition?arrow_forwardSuppose that a particle moves along a straight line with velocity v (t) = 62t, where 0 < t <3 (v(t) in meters per second, t in seconds). Find the displacement d (t) at time t and the displacement up to t = 3. d(t) ds = ["v (s) da = { The displacement up to t = 3 is d(3)- meters.arrow_forwardLet f (x) = x², a 3, and b = = 4. Answer exactly. a. Find the average value fave of f between a and b. fave b. Find a point c where f (c) = fave. Enter only one of the possible values for c. c=arrow_forward
- please do Q3arrow_forwardUse the properties of logarithms, given that In(2) = 0.6931 and In(3) = 1.0986, to approximate the logarithm. Use a calculator to confirm your approximations. (Round your answers to four decimal places.) (a) In(0.75) (b) In(24) (c) In(18) 1 (d) In ≈ 2 72arrow_forwardFind the indefinite integral. (Remember the constant of integration.) √tan(8x) tan(8x) sec²(8x) dxarrow_forward
- Find the indefinite integral by making a change of variables. (Remember the constant of integration.) √(x+4) 4)√6-x dxarrow_forwarda -> f(x) = f(x) = [x] show that whether f is continuous function or not(by using theorem) Muslim_mathsarrow_forwardUse Green's Theorem to evaluate F. dr, where F = (√+4y, 2x + √√) and C consists of the arc of the curve y = 4x - x² from (0,0) to (4,0) and the line segment from (4,0) to (0,0).arrow_forward
- Evaluate F. dr where F(x, y, z) = (2yz cos(xyz), 2xzcos(xyz), 2xy cos(xyz)) and C is the line π 1 1 segment starting at the point (8, ' and ending at the point (3, 2 3'6arrow_forwardCan you help me find the result of an integral + a 炉[メをメ +炉なarrow_forward2 a Can you help me find the result of an integral a 아 x² dxarrow_forward
 Calculus: Early TranscendentalsCalculusISBN:9781285741550Author:James StewartPublisher:Cengage Learning
 Thomas' Calculus (14th Edition)CalculusISBN:9780134438986Author:Joel R. Hass, Christopher E. Heil, Maurice D. WeirPublisher:PEARSON
 Calculus: Early Transcendentals (3rd Edition)CalculusISBN:9780134763644Author:William L. Briggs, Lyle Cochran, Bernard Gillett, Eric SchulzPublisher:PEARSON
 Calculus: Early TranscendentalsCalculusISBN:9781319050740Author:Jon Rogawski, Colin Adams, Robert FranzosaPublisher:W. H. Freeman
 Calculus: Early Transcendental FunctionsCalculusISBN:9781337552516Author:Ron Larson, Bruce H. EdwardsPublisher:Cengage Learning