
Concept explainers
Videos
a.
To identify: the independent and dependent variables and explain their role in the context of the problem.
a.
Answer to Problem 81E
Explanation of Solution
Given:
Function:
Where n is the number of structurally deficient bridges and t represents the year from 2006 through 2017.

In the given situation, the number of structurally deficient bridges in thousands, n is represented in terms of t .
Therefore, variable n depends on t .
Here, the independent variable is t and the dependent variable is n .
Conclusion:
Independent variable − t.
Dependent variable − n.
b.
To tabulate: the number of structurally deficient bridges from 2006 through 2017.
b.
Explanation of Solution
Given:
Function:
Where n is the number of structurally deficient bridges and t represents the year from 2006 through 2017.
Calculation:
Substituting the number of years starting from 6 for 2006, 7 for 2007, ….. so on, find the number of structurally deficient bridges.
Make a table of two columns and fill it up as follows.
When the values are in the range
Function:
| Number ( in thousands) | Year ( 2006 − 2009) |
| 75.424 | 6 |
| 73.961 | 7 |
| 72.936 | 8 |
| 72.349 | 9 |
When the values are in the range
Function:
| Number ( in thousands) | Year ( 2010− 2017) |
| 70.9 | 10 |
| 68.51 | 11 |
| 66.12 | 12 |
| 63.73 | 13 |
| 61.34 | 14 |
| 58.95 | 15 |
| 56.56 | 16 |
| 54.17 | 17 |
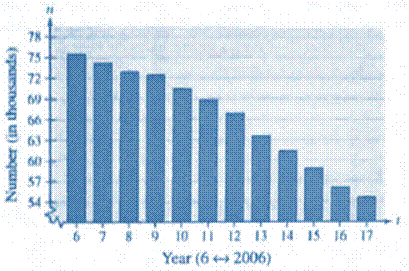
c.
To compare: the values in part (b) with the actual values in the given figure.
c.
Answer to Problem 81E
Yes, the data fits well.
Explanation of Solution
Given:
Function:
Where n is the number of structurally deficient bridges and t represents the year from 2006 through 2017.

Calculation:
Comparing the table in part (b) with the given figure, the values are nearly the same.
Thus, the data fits well if the difference in values is less than the one or equal to the other.
Conclusion:
The given data fits well.
d.
To check: if the piecewise-defined function could be used to predict if the number of structurally deficient bridges for years outside the domain .
d.
Answer to Problem 81E
No.
Explanation of Solution
Given:
Function:
Where n is the number of structurally deficient bridges and t represents the year from 2006 through 2017.

The function may not be true for the values beyond the mentioned intervals in the domain.
Conclusion:
The piecewise-defined function could not be used to predict if the number of structurally deficient bridges for years outside the domain.
Chapter 1 Solutions
PRECALCULUS W/LIMITS:GRAPH.APPROACH(HS)


 Calculus: Early TranscendentalsCalculusISBN:9781285741550Author:James StewartPublisher:Cengage Learning
 Thomas' Calculus (14th Edition)CalculusISBN:9780134438986Author:Joel R. Hass, Christopher E. Heil, Maurice D. WeirPublisher:PEARSON
 Calculus: Early Transcendentals (3rd Edition)CalculusISBN:9780134763644Author:William L. Briggs, Lyle Cochran, Bernard Gillett, Eric SchulzPublisher:PEARSON
 Calculus: Early TranscendentalsCalculusISBN:9781319050740Author:Jon Rogawski, Colin Adams, Robert FranzosaPublisher:W. H. Freeman
 Calculus: Early Transcendental FunctionsCalculusISBN:9781337552516Author:Ron Larson, Bruce H. EdwardsPublisher:Cengage Learning