
Concept explainers
Videos
(a)
To find: The equation and
(a)
Answer to Problem 32E
The
Explanation of Solution
Given information:
The least squares regression line for a set of data. The equations and r-values for the models are given.
Formula used:
The TI83 calculator is used.
Calculation:
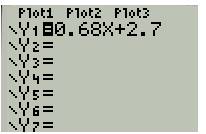
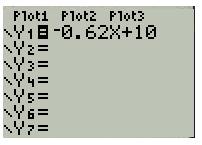
Consider the following equation
Use TI83 calculator to draw the graph of the equation
Step1: Press Y: button and enter the above equation
The display is as shown below
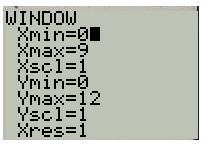
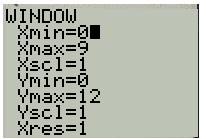
Step2: Press WINDOW button and set the range of the axis
The display is as shown below
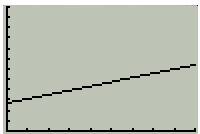
Step3: Press Graph button to graph the above sequence
The display is as shown below
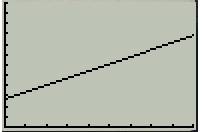
Note that the above graph is same as the graph provide in option (iii).
Therefore, the equation
Also, since the slope of the equation
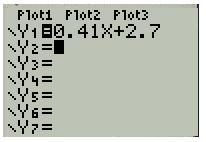
Consider the following equation
Use TI83 calculator to draw the graph of the equation
Step1: Press Y: button and enter the above equation
The display is as shown below
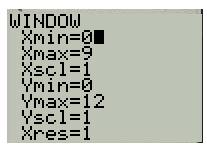
Step2: Press WINDOW button and set the range of the axis
The display is as shown below
Step3: Press Graph button to graph the above sequence
The display is as shown below
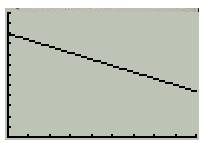
Note that the above graph is same as the graph provide in option (ii).
Therefore, the equation y = 0.41x + 2.7 represents the graph (ii)
Also, since the slope of the equation
Consider the following equation
Use T|83 calculator to draw the graph of the equation
Step1: Press Y: button and enter the above equation
The display is as shown below
Step2: Press WINDOW button and set the range of the axis
The display is as shown below
Step3: Press Graph button to graph the above sequence
The display is as shown below
Note that the above graph is same as the graph provide in option (i).
Therefore, the equation
Also, since the slope of the equation
Conclusion:
The correlation coefficient that represents the graph.
(b)
To analyse: The model that best fits the data.
(b)
Answer to Problem 32E
The model number 3 fits the data well which represents
Explanation of Solution
Given information:
According to the correlation coefficients, to determine the best fit for the data.
Formula used:
Correlation coefficients are used.
Calculation:
According to the correlation coefficients, model number 3 fits the data well which represents
Conclusion:
The model number 3 fits the data well which represents
Chapter 1 Solutions
PRECALCULUS W/LIMITS:GRAPH.APPROACH(HS)


- 2:21 MM -8 -7 -6 -5 -4 0 5 4 3 2 N -3 -4 +5 +6 5G 100% Identify the function whose graph appears above. f(x) = = tan X 3 ✓ Question Help: ☐ Video ☐ Message instructor Submit Question |||arrow_forward4 3. 2. 1 0 Π 元 -1 3 x -53. 5π 2π The graph of the function y = f(x) is shown in the xy-plane. Which of the following is the graph of the polar function r = f(e) in the polar coordinate system? A B Polar axis Polar axis Polar axis Polar axisarrow_forward٣:٥٣ النموذج الاول . . . O O O بشما ند الحمر الحمر الجمهورية الجنية وزارة التربية والتعليم اليوم التاريخ اللجنة العليا للاختبارات الزمن اختبار مادة الجبر والهندسة لجنة المطابع السرية المركزية للشهادة الثانوية العامة (القسم العلمي) الفترة %97 (1) ظلل في ورقة الإجابة الدائرة التي تحتوي على الحرف ( ص ) للإجابة الصحيحة والحرف ( خ ) للإجابة الخطأ بحسب رقم الفقرة لكل مما يأتي ( درجة لكل فقرة ) )1 ) 2 ) 3 ) 4 ) بؤرة القطع س" = ١٢ ص هي ( ۲ ) طول المحور الأصغر للقطع ٩ س + ص = ٩ يساوي 6 وحدات طول . ) إذا كان & عدد مركب ، 181 + 11 = ٦ ، فإن ١١ = ٣ . ) إذا كان م + ۳ ت = ۲ + ت ب م ، ب دع ، فإن م + ب = 5 ( ) إذا كان & = ۱ + ٣ ت ، فإن ٠ = ١٠ . 6 ( - ) إذا كان ٥٠ - ٣ - ١٢٠ ٤ - ٣ ، فإن قيمة ٧ = ٥ . 1 ) = N ) إذا كان ح هو الحد الخالي من س في المفكوك ( س + v. N 8 ( ( قيمة المقدار , = + ۱ ، * . . + ، فإن قيمة ٧ = ١٦ . ۱ + 9 ( ) المستقيمان المقاربان للقطع الذي معادلته س" = ١ هما ص = : ۹ 10 ( ) إذا كان ٥ + س = ٢٤ ، فإن قيمة س = - 1 س 11 ( ) إذا كانت النسبة بين الحدين الأوسطين تساوي 9 في المفكوك ( س + - ) ،…arrow_forward
- الاسم يمنع استخدام الآلة الحاسبة ظلل في ورقة الإجابة الدائرة التي تحتوي على الحرف (ص) للإجابة الصحيحة والحرف (خ) للإجابة الخطأ بحسب رقم الفقرة لكل مما يأتي: درجة لكل فقرة. ( ) نها جا 元 جتا = صفر س ۱ س س -۱ ( ) يمكن إعادة تعريف الدالة د(س) = س قاس لكي تكون متصلة عند س = 7 ( ) إذا كانت د(س) = (٢) س - س ) ؛ فإن د(١) = ٦ ٢ س ص ( ) إذا كانت س + 0= ؛ فإن عند ) - ١ ، - ٦ ) تساوي (٦) ( ) إذا كانت د(س) = س ه ، و (س) = ٣ س ٢ + ٢ س ؛ فإن ( د ) (۱) = ۸ ) ( معادلة ناظم الدالة ص = د(س) عند النقطة ) ( ، د (۲)) هي ص - (د (م) - - د (۲) ( س - م ) ( ) إذا كانت ص = ظتا٢ س ؛ فإن ص = ٢ ص قتا ٢س ) ( إذا كانت د(س) = س ؛ فإن د (T) = جتاس 1- T ( ) إذا كانت د(س) = 1 - جناس جاس ؛ فإن د () = - 1 ( ) إذا كانت الدالة د (س) تحقق شروط مبرهنة القيمة المتوسطة على [ ، ب ] ، فإنه يوجد جـ ] ، ب [ بحيث (جـ) = (P) + (~)- - ب + P 1 2 3 4 5 6 7 8 9 10 11 ( ) للدالة د(س) = لو ( س ) + (٣) نقطة حرجة عند س = . ( ) إذا كان س = - ٢ مقارباً رأسياً للدالة د(س) 12 10 13 14 15 16 17 س = لو|س | + ث - = ۲ س + ٣ ب س + ٤ ، فإن معادلة…arrow_forward2. Symmetry Evaluate the following integrals using symmetry argu- ments. Let R = {(x, y): -a ≤ x ≤ a, −b ≤ y ≤ b}, where a and b are positive real numbers. a. SS Sf xye xye¯(x² + y²) dA R b. C sin (x − y) - dA x² + y² + 1 Rarrow_forwardChoose a convenient order When converted to an iterated integral, the following double integrals are easier to evaluate in one order please show all stepsarrow_forward
- The graph of f' is below. Use it to determine where the local minima and maxima for f are. If there are multiple answers, separate with commas. 2 f'(x) N -5 -4 3-2-1 -1 -2 -3 -4 12 3 4 5 -x Local minima at x Local maxima at xarrow_forwardThe graph of f' is below. Use it to determine the intervals where f is increasing. -5-4-32 4- 3 2 1 -2 -3 +x 2 3 4 5arrow_forwardThe graph of f' is below. Use it to determine where the inflection points are and the intervals where f is concave up and concave down. If there are multiple inflection points, separate with a comma. 6 5 4 3 2 1 f'(x) +x -6-5-4-3 -2 -1 1 2 3 4 5 6 -1 -2 -3 -4 -5 -6+ Inflection point(s) at x = Concave up: Concave down:arrow_forward
 Calculus: Early TranscendentalsCalculusISBN:9781285741550Author:James StewartPublisher:Cengage Learning
 Thomas' Calculus (14th Edition)CalculusISBN:9780134438986Author:Joel R. Hass, Christopher E. Heil, Maurice D. WeirPublisher:PEARSON
 Calculus: Early Transcendentals (3rd Edition)CalculusISBN:9780134763644Author:William L. Briggs, Lyle Cochran, Bernard Gillett, Eric SchulzPublisher:PEARSON
 Calculus: Early TranscendentalsCalculusISBN:9781319050740Author:Jon Rogawski, Colin Adams, Robert FranzosaPublisher:W. H. Freeman
 Calculus: Early Transcendental FunctionsCalculusISBN:9781337552516Author:Ron Larson, Bruce H. EdwardsPublisher:Cengage Learning