
Concept explainers
Videos
(a)
To graph: To sketch the graph of the given data of sales for Nike, Inc. from the year 2011 to 2017.
(a)
Explanation of Solution
Given information: The table below shows the sales y (in billions of dollars) for Nike, Inc. for each year x from 2011 through 2017, where
| Year x | Sales y |
| 1 | 20.9 |
| 2 | 24.1 |
| 3 | 25.3 |
| 4 | 27.8 |
| 5 | 30.6 |
| 6 | 32.4 |
| 7 | 34.4 |
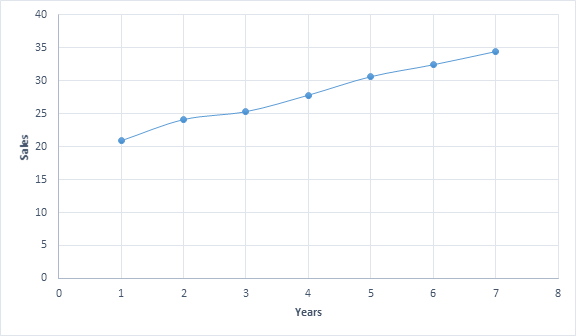
Interpretation: Graph of the sales for Nike, Inc. from 2011 to 2017 is linear and increasing.
That is the sales increases gradually from 2011 to 2017.
(b)
To determine the years in which the sales showed the greatest and least increase.
(b)
Answer to Problem 92E
The year in which the sales showed the greatest increase is 2011
The year in which the sales showed the least increase is 2012
Explanation of Solution
Given information: The table below shows the sales y (in billions of dollars) for Nike, Inc. for each year x from 2011 through 2017, where
| Year x | Sales y |
| 1 | 20.9 |
| 2 | 24.1 |
| 3 | 25.3 |
| 4 | 27.8 |
| 5 | 30.6 |
| 6 | 32.4 |
| 7 | 34.4 |
Formula used: Slope between the points
Calculation:
The slopes between the years can be calculated as:
The year in which the sales showed the greatest increase is between 2011 and 2012
(Since
The year in which the sales showed the least increase is between 2012 and 2013
(Since
(c)
Equation of the line between the years 2011 and 2017
(c)
Answer to Problem 92E
Equation of the line between the years 2011 and 2017 is
Explanation of Solution
Given information: Sales in the year 2011 is 20.9 and sales in the year 2017 is 34.4
Formula used: Equation of the line passing through the points
Calculation:
Slope between the years 2011 and 2017,
∴Equation of the line between the years 2011 and 2017is
(d)
To interpret the slope of the line in part (c)
(d)
Answer to Problem 92E
Slope of the line is the average rate of change
Explanation of Solution
Given information: Slope between the years 2011 and 2017 is 2.25
Slope of the line is the average rate of change. Therefore, the rate of change of sales over the years 2011 and 2017 is 2.25
(e)
To estimate the sales in 2021
(e)
Answer to Problem 92E
Sales in 2021 is 43.4 billion dollars
Explanation of Solution
Given information: Equation of the line between the years 2011 and 2017 is
Calculation:
When
- becomes
∴ Sales in 2021 is 43.4 billion dollars.
The estimate sales in the year 2021 using the formula in (1) may or may not be accurate.
Because the sales in the year 2021 depends on the sales in the previous years and other factors which cannot be determined using the equation.
That is, the actual answer can vary.
Chapter 1 Solutions
PRECALCULUS W/LIMITS:GRAPH.APPROACH(HS)


- R₂ = X2 2) slots per pole per phase = 3/3 1 B-180-60 msl Ka Sin (1) Isin () sin(30) Sin (30) اذا ميريد شرح الكتب بس 0 بالفراغ 3) Cos (30) 0.866 4) Rotating 5) Synchronous speed, 120 x 50 s = 1000-950 1000 Copper losses 5kw Rotor input 5 6) 1 0.05 G 50105 loo kw اذا ميريد شرح الكتب فقط look 7) rotov DC ined sove in peaper I need a detailed solution on paper please 064 2- A hot ball (D=15 cm ) is cooled by forced air T.-30°C, the rate of heat transfer from the ball is 460.86 W. Take for the air -0.025 Wim °C and Nu=144.89, find the ball surface temperature a) 300 °C 16 b) 327 °C c) 376 °C d) None か = 750 01arrow_forwardDon't do 14. Please solve 19arrow_forwardPlease solve 14 and 15arrow_forward
- 1. Consider the following system of equations: x13x2 + 4x3 - 5x4 = 7 -2x13x2 + x3 - 6x4 = 7 x16x213x3 - 21x4 = 28 a) Solve the system. Write your solution in parametric and vector form. b) What is a geometric description of the solution. 7 c) Is v = 7 in the span of the set S= [28. 1 HE 3 -5 3 ·6 ? If it is, write v 6 as a linear combination of the vectors in S. Justify. d) How many solutions are there to the associated homogeneous system for the system above? Justify. e) Let A be the coefficient matrix from the system above. Find the set of all solutions to Ax = 0. f) Is there a solution to Ax=b for all b in R³? Justify.arrow_forward4. Suppose that A is made up of 5 column vectors in R³, and suppose that the rank(A)=3. a. How many solutions are there to Ax=0? Justify. b. What is a geometric description for the nullspace(A)? Justify. c. Do the column vectors of A span R³? Justify. d. Is A invertible? Justify.arrow_forward3. Suppose that A is 5 x 5 and rank(A)=4. Use this information to answer the following. a. Give a geometric description of nullspace(A). Justify. b. Is A invertible? Justify. c. Give a geometric description of the span of the column vectors of A. What space are the column vectors of A in? Justify. d. What is determinant of A? Justify.arrow_forward
- 2. Consider the matrix: A || 1 1 -3 14 2 1 01 4 1 2 2 -26 1 -3 1 5] a) What is rank(A)? b) Is A invertible? Justify. c) Find the nullspace(A). Justify. d) Is the trivial solution the only solution to Ax=0? Justify. e) What is the span of the column vectors of A? Justify.arrow_forwardE 5. Suppose that S={v € R²: v = [2x² - 3]}. Is S a subspace of R²? Prove or disprovearrow_forward6. Suppose that V1, V2 ER", show that span{v1, v2} is a subspace of Rn.arrow_forward
- Ra X 2) slots per pole per phase 3/31 180 Ko Sin (1) Kdl 1 sin (4) sin(3) Sin (30) اذا مرید شرح الكتب بس 0 بالفراغ 3) Cos (30) 0.866 4) Rotating 5) Synchronous speed, 120 Fo lasa! G s.1000-950 20:05 1000 Capper losses: 5kw Rotor input lookw 0.05 ined sove in peaper I need a detailed solution on paper please 6) 1 ۳/۱ وه اذا ميريد شرح الكتب فقط look DC 7) rotov Find the general solution of the following equations: +4y=tan2x 3 7357 Find the general solution of the following equations: - Qll y + y (³) = 0. 101arrow_forwardB: 18060 msl Kd Ka, Sin (n) I sin () sin(30) Sin (30) اذا ميريد شرح الكتب بس 0 بالفراغ 3) Cos (30) 0.866 4) Rotating 5) Synchronous speed, 120 x 50 G 5005 1000 s = 1000-950 Copper bosses 5kW /0001 Rotor input 5 : loo kw 0.05 6) 1 اذا ميريد شرح الكتب فقط ١٥٠ 7) rotov DC ined sove in Deaper I need a detailed solution on paper please dy x+2y-4 = dx 2x-y-3 Find the general solution of the following equations: 02//yl-4y+13y=esinarrow_forward1) R₂ = X2 2) slots per pole per phase = 3/31 B msl kd 180 60 Kal Sin (1) I sin () sin(30) Sin (30) اذا ميريد شرح الكتب بس 0 بالفراغ 3) Cos (30) 0.866 4) Rotating 5) Synchronous speed, 120 x 50 G 5005 1000 s = 1000-950 Copper bosses 5kW Rotor input: 5 0.05 loo kw 6) 1 /0001 اذا ميريد شرح الكتب فقط look 7) rotov DC ined sove in peaper I need a detailed solution on paper please Q1// Find the solution of: 'y' = x² +376 x4+316 xyo Q2 Find the solution of the initial-valued problems: ex-y y' +exarrow_forward
 Calculus: Early TranscendentalsCalculusISBN:9781285741550Author:James StewartPublisher:Cengage Learning
 Thomas' Calculus (14th Edition)CalculusISBN:9780134438986Author:Joel R. Hass, Christopher E. Heil, Maurice D. WeirPublisher:PEARSON
 Calculus: Early Transcendentals (3rd Edition)CalculusISBN:9780134763644Author:William L. Briggs, Lyle Cochran, Bernard Gillett, Eric SchulzPublisher:PEARSON
 Calculus: Early TranscendentalsCalculusISBN:9781319050740Author:Jon Rogawski, Colin Adams, Robert FranzosaPublisher:W. H. Freeman
 Calculus: Early Transcendental FunctionsCalculusISBN:9781337552516Author:Ron Larson, Bruce H. EdwardsPublisher:Cengage Learning