Concept explainers
(a)
Interpretation: To indicate whether hexokinase is associated with carbohydrate digestion or the glycolysis
Concept introduction: Carbohydrates are the
Carbohydrates are classified as monosaccharide, disaccharide, oligosaccharide, and polysaccharide. Monosaccharides are the simplest carbohydrate units that cannot be hydrolyzed further to give the smallest units. Disaccharides contain two monosaccharide units. Oligosaccharides contain 3 to 10 monosaccharide units. Polysaccharides contain many carbohydrate units that vary from 100 to 50,000 monosaccharide units.
In the glycolysis metabolic pathway, a glucose molecule breaks down and is converted into two pyruvate molecules along with the production of two ATP molecules and NADH coenzymes.
The block diagram to represent an overview of glycolysis is as follows:
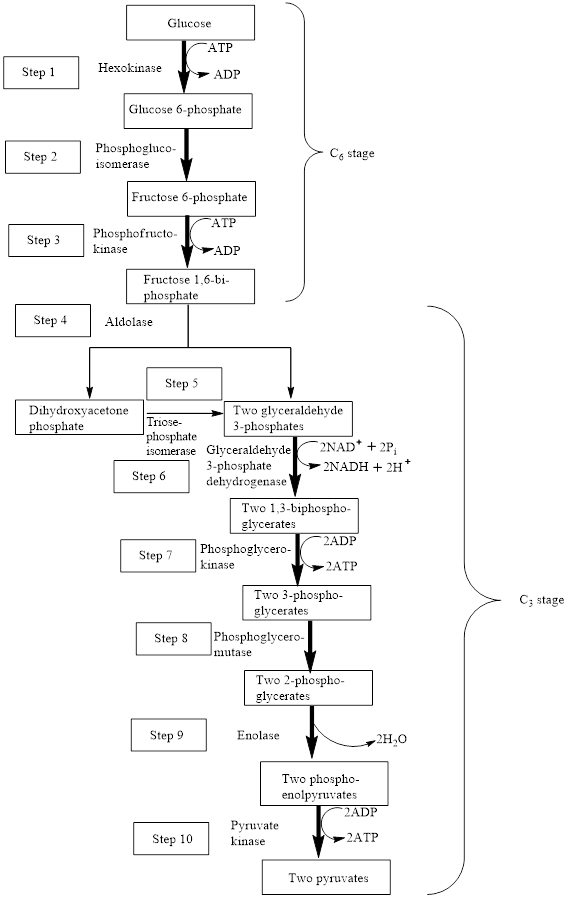
From the above diagram, it is concluded that in the overall process of glycolysis, two stages are present.
a) Steps 1 to 3 represents a six-carbon stage
b) Steps 4 to 10 represent a three-carbon stage
(b)
Interpretation: To indicate whether lactase is associated with carbohydrate digestion or the glycolysis metabolic pathway.
Concept introduction: Carbohydrates are the biomolecules composed of carbon, oxygen and hydrogen atoms. Carbohydrate molecules are joined together by glycosidic linkage.
Carbohydrates are classified as monosaccharide, disaccharide, oligosaccharide, and polysaccharide. Monosaccharides are the simplest carbohydrate units that cannot be hydrolyzed further to give the smallest units. Disaccharides contain two monosaccharide units. Oligosaccharides contain 3 to 10 monosaccharide units. Polysaccharides contain many carbohydrate units that vary from 100 to 50,000 monosaccharide units.
In the glycolysis metabolic pathway, a glucose molecule breaks down and is converted into two pyruvate molecules along with the production of two ATP molecules and NADH coenzymes.
The block diagram to represent an overview of glycolysis is as follows:
From the above diagram, it is concluded that in the overall process of glycolysis, two stages are present.
a) Steps 1 to 3 represents a six-carbon stage
b) Steps 4 to 10 represent a three-carbon stage
(c)
Interpretation: To indicate whether the hydrolysis reaction is associated with carbohydrate digestion or the glycolysis metabolic pathway.
Concept introduction: Carbohydrates are the biomolecules composed of carbon, oxygen and hydrogen atoms. Carbohydrate molecules are joined together by glycosidic linkage.
Carbohydrates are classified as monosaccharide, disaccharide, oligosaccharide, and polysaccharide. Monosaccharides are the simplest carbohydrate units that cannot be hydrolyzed further to give the smallest units. Disaccharides contain two monosaccharide units. Oligosaccharides contain 3 to 10 monosaccharide units. Polysaccharides contain many carbohydrate units that vary from 100 to 50,000 monosaccharide units.
In the glycolysis metabolic pathway, a glucose molecule breaks down and is converted into two pyruvate molecules along with the production of two ATP molecules and NADH coenzymes.
The block diagram to represent an overview of glycolysis is as follows:
From the above diagram, it is concluded that in the overall process of glycolysis, two stages are present.
a) Steps 1 to 3 represents a six-carbon stage
b) Steps 4 to 10 represent a three-carbon stage
(d)
Interpretation: To indicate whether the dehydration reaction is associated with carbohydrate digestion or the glycolysis metabolic pathway.
Concept introduction: Carbohydrates are the biomolecules composed of carbon, oxygen and hydrogen atoms. Carbohydrate molecules are joined together by glycosidic linkage.
Carbohydrates are classified as monosaccharide, disaccharide, oligosaccharide, and polysaccharide. Monosaccharides are the simplest carbohydrate units that cannot be hydrolyzed further to give the smallest units. Disaccharides contain two monosaccharide units. Oligosaccharides contain 3 to 10 monosaccharide units. Polysaccharides contain many carbohydrate units that vary from 100 to 50,000 monosaccharide units.
In the glycolysis metabolic pathway, a glucose molecule breaks down and is converted into two pyruvate molecules along with the production of two ATP molecules and NADH coenzymes.
The block diagram to represent an overview of glycolysis is as follows:
From the above diagram, it is concluded that in the overall process of glycolysis, two stages are present.
a) Steps 1 to 3 represents a six-carbon stage
b) Steps 4 to 10 represent a three-carbon stage
Want to see the full answer?
Check out a sample textbook solution
Chapter 13 Solutions
Organic And Biological Chemistry


- What is the final product when D-galactose reacts with hydroxylamine?arrow_forwardIndicate the formula of the product obtained by reacting methyl 5-chloro-5-oxopentanoate with 1 mole of 4-penten-1-ylmagnesium bromide.arrow_forwardIn the two chair conformations of glucose, the most stable is the one with all the OH groups in the equatorial position. Is this correct?arrow_forward
- please help me with my homeworkarrow_forwardhelparrow_forwardThe temperature on a sample of pure X held at 1.25 atm and -54. °C is increased until the sample boils. The temperature is then held constant and the pressure is decreased by 0.42 atm. On the phase diagram below draw a path that shows this set of changes. pressure (atm) 2 0 0 200 400 temperature (K) Xarrow_forward
- QUESTION: Answer Question 5: 'Calculating standard error of regression' STEP 1 by filling in all the empty green boxes *The values are all provided in the photo attached*arrow_forwardpressure (atm) 3 The pressure on a sample of pure X held at 47. °C and 0.88 atm is increased until the sample condenses. The pressure is then held constant and the temperature is decreased by 82. °C. On the phase diagram below draw a path that shows this set of changes. 0 0 200 temperature (K) 400 аarrow_forwarder your payment details | bar xb Home | bartleby x + aleksogi/x/isl.exe/1o u-lgNskr7j8P3jH-1Qs_pBanHhviTCeeBZbufuBYT0Hz7m7D3ZcW81NC1d8Kzb4srFik1OUFhKMUXzhGpw7k1 O States of Matter Sketching a described thermodynamic change on a phase diagram 0/5 The pressure on a sample of pure X held at 47. °C and 0.88 atm is increased until the sample condenses. The pressure is then held constant and the temperature is decreased by 82. °C. On the phase diagram below draw a path that shows this set of changes. pressure (atm) 1 3- 0- 0 200 Explanation Check temperature (K) 400 X Q Search L G 2025 McGraw Hill LLC. All Rights Reserved Terms of Use Privacy Cearrow_forward
 Chemistry for Today: General, Organic, and Bioche...ChemistryISBN:9781305960060Author:Spencer L. Seager, Michael R. Slabaugh, Maren S. HansenPublisher:Cengage Learning
 Introduction to General, Organic and BiochemistryChemistryISBN:9781285869759Author:Frederick A. Bettelheim, William H. Brown, Mary K. Campbell, Shawn O. Farrell, Omar TorresPublisher:Cengage Learning
 General, Organic, and Biological ChemistryChemistryISBN:9781285853918Author:H. Stephen StokerPublisher:Cengage Learning
 Organic And Biological ChemistryChemistryISBN:9781305081079Author:STOKER, H. Stephen (howard Stephen)Publisher:Cengage Learning,