Concept explainers
Videos
(a)
To find:The linear regression equation for the given data.
(a)
Answer to Problem 46E
The linear regression equation for the given data is
Explanation of Solution
Given information:The table given below shows the ages and weights of nine girls:
| Girl’s ages and weights | |
| Age (months) | Weight (pounds) |
| 19 | 22 |
| 21 | 23 |
| 24 | 25 |
| 27 | 28 |
| 29 | 31 |
| 31 | 28 |
| 34 | 32 |
| 38 | 34 |
| 43 | 39 |
Calculation:
To find the linear regression equation of the given data, use graphing calculator.
Step 1: Press
Step 2: List the input values 19, 21, 24, 27, 29, 31, 34, 38 and 43 in the L1 column.
Step 3: List the input values 22, 23, 25, 28, 31, 28, 32, 34 and 39 in the L2 column.
Step 4: Press the keystrokes
Therefore, thelinear regression equation for the given data is
(b)
To find: The slope of the regression line for the given data and describe the representation of the slope.
(b)
Answer to Problem 46E
The slope of the regression line for the given data is 0.68 and it represents the average weight in pounds per month gain in girls from 1 to 4 years old.
Explanation of Solution
Given information:The table given below shows the ages and weights of nine girls:
| Girl’s ages and weights | |
| Age (months) | Weight (pounds) |
| 19 | 22 |
| 21 | 23 |
| 24 | 25 |
| 27 | 28 |
| 29 | 31 |
| 31 | 28 |
| 34 | 32 |
| 38 | 34 |
| 43 | 39 |
Calculation:
From part (a), the linear regression equation for the given data is
It is known that slope-form of a line is
Therefore, the slope of the regression line for the given data is 0.68 and it represents the average weight in pounds per month gain in girls from 1 to 4 years old.
(c)
To plot: The graph of the linear regression equation on a
(c)
Explanation of Solution
Given information:The table given below shows the ages and weights of nine girls:
| Girl’s ages and weights | |
| Age (months) | Weight (pounds) |
| 19 | 22 |
| 21 | 23 |
| 24 | 25 |
| 27 | 28 |
| 29 | 31 |
| 31 | 28 |
| 34 | 32 |
| 38 | 34 |
| 43 | 39 |
Graph:
To make the scatter plot enter the data, then follow the stepsusing graphing calculator.
Step 1: Press
Step 2: Press
Step 3: Press the keystrokes
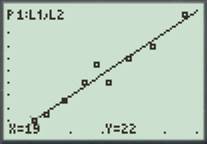
Figure (1)
Interpretation:From the graph it can be interpreted that the weight of girls is increasing as there is increasing.
(d)
To find: The weight of 30 month old girl by using the regression equation.
(d)
Answer to Problem 46E
The approximate weight of 30 month old girl is 29.4 pounds.
Explanation of Solution
Given information:The table given below shows the ages and weights of nine girls:
| Girl’s ages and weights | |
| Age (months) | Weight (pounds) |
| 19 | 22 |
| 21 | 23 |
| 24 | 25 |
| 27 | 28 |
| 29 | 31 |
| 31 | 28 |
| 34 | 32 |
| 38 | 34 |
| 43 | 39 |
Calculation:
From part (a), the linear regression equation for the given data is
To find the weight of 30 month old girl, substitute 30 for
Therefore, the approximate weight of 30 month old girl is 29.4 pounds.
Chapter 1 Solutions
Calculus 2012 Student Edition (by Finney/Demana/Waits/Kennedy)
Additional Math Textbook Solutions
Calculus: Early Transcendentals (2nd Edition)
Elementary Statistics
Elementary Statistics: Picturing the World (7th Edition)
A Problem Solving Approach To Mathematics For Elementary School Teachers (13th Edition)
Thinking Mathematically (6th Edition)
College Algebra (7th Edition)


- Given the following graph of the function y = f(x) and n = = 6, answer the following questions about the area under the curve from x graph to enlarge it.) 1 (Round your answer to within two decimal places if necessary, but do not round until your final computation.) a. Use the Trapezoidal Rule to estimate the area. Estimate: T6 G b. Use Simpson's Rule to estimate the area. Estimate: S6 - ID = 0 to x = 6. (Click on aarrow_forward"Solve the following differential equation using the Operator Method and the Determinant Method:" Solve by dr no ai """'+3y"" + 3y+y=arrow_forward(4,4) M -4 2 2 -4 (-4,-4) 4 8 10 12 (8,-4) (12,-4) Graph of f The figure shows the graph of a piecewise-linear function f. For −4≤x≤12, the function g is x defined by g(x) = √ƒ (t)dt . . Find the value of g(6). Find the value of g'(6). |arrow_forward
- PREVIOUS ANSWERS ASK YOUR TEACHER PRACTICE ANOTHER Find the derivative of the function. f'(x) = X x + √3x f(x) = 3x-5 (3√√3x+11√√x+5√3 2√√x (3x-5)² Need Help? Read It SUBMIT ANSWERarrow_forwardPREVIOUS ANSWERS ASK YOUR TEACHER PRACTICE A Find the derivative of the function and evaluate f'(x) at the given val f(x) = (√√√x + 3x) (x3/2 - x); x = 1 f'(x) = 9x 412 (12x (13) 2 - 4x-3√√√x f'(1) = 2 Need Help? Read It Watch It SUBMIT ANSWERarrow_forwardConsider the following functions. g(x) = x + √3x h(x) = 3x-5 x + √3x f(x) = = 3x-5 Find the derivative of each function. g'(x) h'(x) = = f'(x) = 3 = +1 2√3x 3 (3√3x + 10√√x +5√√√3 2√√x (3x-5)² Need Help? Read It SUBMIT ANSWERarrow_forward
- "Solve the following differential equation using the Operator Method and the Determinant Method:" y'''' + 3y'"' + 3y'' + y = xarrow_forwardpractice for exam please helparrow_forwardFig. 4.22. Problems 4.1 (A). Determine the second moments of area about the axes XX for the sections shown in Fig. 4.23. [15.69, 7.88, 41.15, 24; all x 10-6 m. All dimensions in mm IAA inn 100 25 50 25 50 80 50 50 Fig. 4.23. X 80 60arrow_forward
- 4.3 (A). A conveyor beam has the cross-section shown in Fig. 4.24 and it is subjected to a bending moment in the plane YY. Determine the maximum permissible bending moment which can be applied to the beam (a) for bottom flange in tension, and (b) for bottom flange in compression, if the safe stresses for the material in tension and compression are 30 MN/m² and 150 MN/m² respectively. Y [32.3, 84.8 kNm.] 150 100 50 -25 +50-50-50-50- All dimensions in mmarrow_forward"Find the values of V1, V2, and V3 by solving the following differential equation system:" 1 L1 1 X - X x 2 - 2x x2 x3 x² - 4x + 2] M Larrow_forward1. Consider the function f(x) whose graph is given below. Use the graph to determine the following: 2 a) All x for which f'(x) is positive. b) All x for which f'(x) is negative. 2 -2 c) The x for which f'(x) is zero. (please depict this on the graph)arrow_forward
 Calculus: Early TranscendentalsCalculusISBN:9781285741550Author:James StewartPublisher:Cengage Learning
 Thomas' Calculus (14th Edition)CalculusISBN:9780134438986Author:Joel R. Hass, Christopher E. Heil, Maurice D. WeirPublisher:PEARSON
 Calculus: Early Transcendentals (3rd Edition)CalculusISBN:9780134763644Author:William L. Briggs, Lyle Cochran, Bernard Gillett, Eric SchulzPublisher:PEARSON
 Calculus: Early TranscendentalsCalculusISBN:9781319050740Author:Jon Rogawski, Colin Adams, Robert FranzosaPublisher:W. H. Freeman
 Calculus: Early Transcendental FunctionsCalculusISBN:9781337552516Author:Ron Larson, Bruce H. EdwardsPublisher:Cengage Learning