Concept explainers
Videos
(a)
To draw: Thegraph of equations
(a)
Explanation of Solution
Given information:The given parametric equations are
Graph:
Consider
The parametric equation for
The parametric equation for
The parametric equation for
Now, draw the graph of parametric equations in the same viewing window in the interval
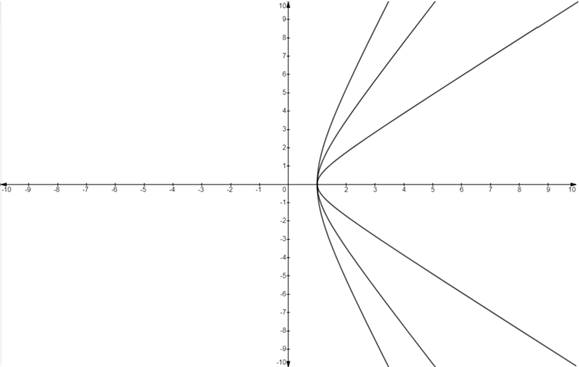
Figure (1)
Interpretation: From the graph it can be observed that the graph of parametric equation for different values of a andb is the right half of a hyperbola that lies in Quadrant I and IV. The value of a gives x -intercept, b describes the shape of hyperbola.
As the value of b increases, the curve of hyperbola goes away from the x -axis and becomes shallower.
(b)
To draw: The graph of equations
(b)
Explanation of Solution
Given information:The given parametric equations are
Graph:
Substitute 2 for a in the equation
Substitute 3 for b in the equation
Now, draw the graph of parametric equations in the interval
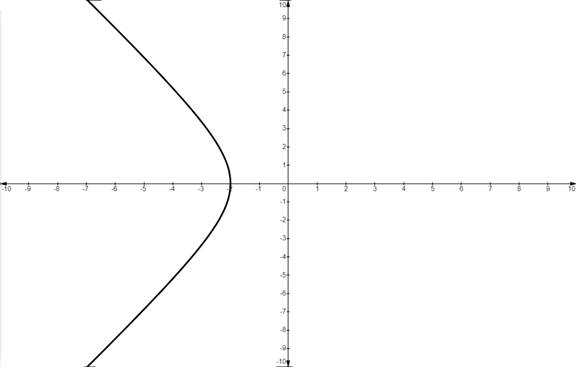
Figure (2)
Interpretation: From the graph it can be observed that the graph of parametric equations is a left half of the hyperbola in second quadrant and third quadrant.
(c)
To draw: The graph of equations
(c)
Explanation of Solution
Given information:The given parametric equations are
Graph:
Substitute 2 for a in the equation
Substitute 3 for b in the equation
Now, draw the graph of parametric equations in the interval
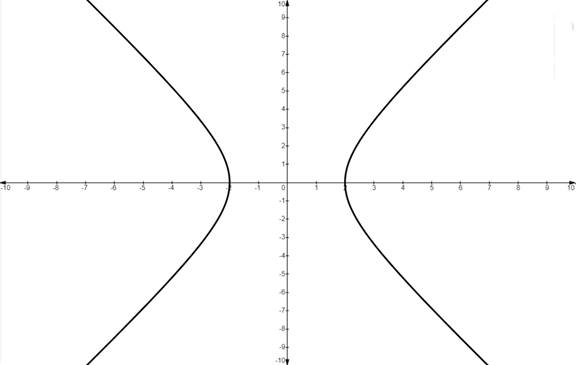
Figure (3)
Interpretation: From the graph it can be observed that the graph of parametric equations is a hyperbola. A student must be careful while drawing the graph in an interval that includes
(d)
To prove: The equation
(d)
Explanation of Solution
Given information:The given parametric equations are
Proof:
It is known that the standard
Substitute
Hence, it is proved that
(e)
To evaluate: Repeatpart (a), (b), (c) and (d) for parametric equations
(e)
Explanation of Solution
Given information:The given parametric equations are
Part (a): Consider
The parametric equation for
The parametric equation for
The parametric equation for
Now, draw the graph of parametric equations in the same viewing window in the interval
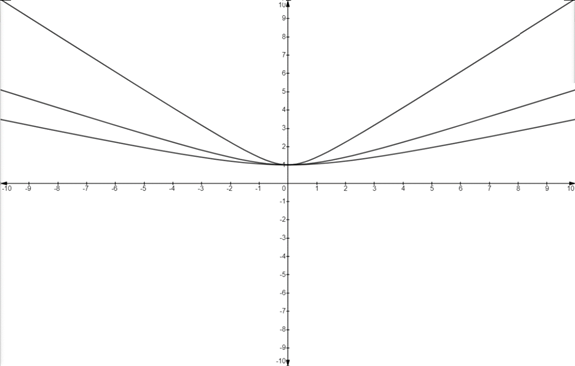
Figure (4)
From the graph it can be observed that the graph of parametric equations is the top half of a hyperbola that lies in first and second Quadrant. The value of b gives y -intercepts and the values ofadescribe the shape of hyperbola.
As the value of a increases, the curve of hyperbola goes away from the y -axis and becomes shallower.
Part (b): Consider
Substitute 2 for a in the equation
Substitute 3 for b in the equation
Now, draw the graph of parametric equations in the interval
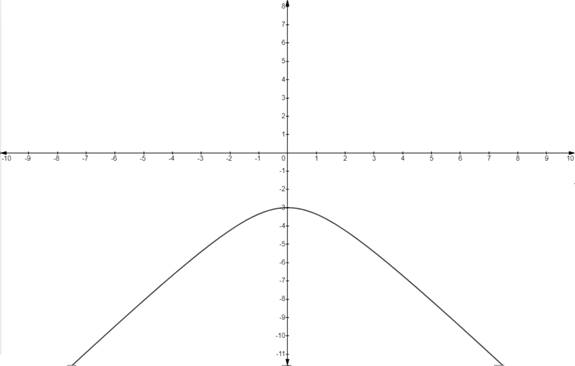
Figure (5)
From the graph it can be observed that the graph of parametric equations is the bottom half of the hyperbola that lies in third and fourth quadrant.
Part (d): It is known that the standard trigonometric identity for
Substitute
Chapter 1 Solutions
Calculus 2012 Student Edition (by Finney/Demana/Waits/Kennedy)
Additional Math Textbook Solutions
Elementary Statistics (13th Edition)
Algebra and Trigonometry (6th Edition)
Elementary Statistics: Picturing the World (7th Edition)
A Problem Solving Approach To Mathematics For Elementary School Teachers (13th Edition)
University Calculus: Early Transcendentals (4th Edition)


- For each graph in Figure 16, determine whether f (1) is larger or smaller than the slope of the secant line between x = 1 and x = 1 + h for h > 0. Explain your reasoningarrow_forwardPoints z1 and z2 are shown on the graph.z1 is at (4 real,6 imaginary), z2 is at (-5 real, 2 imaginary)Part A: Identify the points in standard form and find the distance between them.Part B: Give the complex conjugate of z2 and explain how to find it geometrically.Part C: Find z2 − z1 geometrically and explain your steps.arrow_forwardA polar curve is represented by the equation r1 = 7 + 4cos θ.Part A: What type of limaçon is this curve? Justify your answer using the constants in the equation.Part B: Is the curve symmetrical to the polar axis or the line θ = pi/2 Justify your answer algebraically.Part C: What are the two main differences between the graphs of r1 = 7 + 4cos θ and r2 = 4 + 4cos θ?arrow_forward
- A curve, described by x2 + y2 + 8x = 0, has a point A at (−4, 4) on the curve.Part A: What are the polar coordinates of A? Give an exact answer.Part B: What is the polar form of the equation? What type of polar curve is this?Part C: What is the directed distance when Ø = 5pi/6 Give an exact answer.arrow_forwardNew folder 10. Find the area enclosed by the loop of the curve (1- t², t-t³)arrow_forward1. Graph and find the corresponding Cartesian equation for: t X== y = t +1 2 te(-∞, ∞) 42,369 I APR 27 F5 3 MacBook Air stv A Aa T 4 DIIarrow_forward
- Middle School GP... Echo home (1) Addition and su... Google Docs Netflix Netflix New folder 9. Find the area enclosed by x = sin²t, y = cost and the y-axis.arrow_forward2. Graph and find the corresponding Cartesian equation for: (4 cos 0,9 sin 0) θ ε [0, 2π) 42,369 I APR 27 3 MacBook Air 2 tv A Aaarrow_forward30 Page< 3. Find the equation of the tangent line for x = 1+12, y = 1-3 at t = 2 42,369 APR A 27 M . tv NA 1 TAGN 2 Aa 7 MacBook Air #8arrow_forward
 Calculus: Early TranscendentalsCalculusISBN:9781285741550Author:James StewartPublisher:Cengage Learning
 Thomas' Calculus (14th Edition)CalculusISBN:9780134438986Author:Joel R. Hass, Christopher E. Heil, Maurice D. WeirPublisher:PEARSON
 Calculus: Early Transcendentals (3rd Edition)CalculusISBN:9780134763644Author:William L. Briggs, Lyle Cochran, Bernard Gillett, Eric SchulzPublisher:PEARSON
 Calculus: Early TranscendentalsCalculusISBN:9781319050740Author:Jon Rogawski, Colin Adams, Robert FranzosaPublisher:W. H. Freeman
 Calculus: Early Transcendental FunctionsCalculusISBN:9781337552516Author:Ron Larson, Bruce H. EdwardsPublisher:Cengage Learning