Concept explainers
Videos
(a)
To find:The quadratic regressionfor the datagiven in the table for the gross revenue of Broadway season.
(a)
Answer to Problem 54E
The
Explanation of Solution
Given information:The table given below shows the gross revenue for Broadway season in different years:
| Broadway Season Revenue | |
| Year | Amount ($ millions) |
| 1994 | 406 |
| 1999 | 603 |
| 2004 | 769 |
| 2005 | 862 |
| 2006 | 939 |
| 2007 | 938 |
Calculation:
Consider that
To find the natural logarithm regression equation of the given data, use graphing calculator.
Step 1: Press
Step 2: List the input values 4, 9, 14, 15, 16 and 17 in the L1 column.
Step 3: List the input values 406, 603, 769, 862, 939 and 938 in the L2 column.
Step 4: Press the keystrokes
Therefore, the quadratic regression equation for the Broadway Season Revenue is
(b)
To plot:The graph of the quadratic regression for the given data on a
(b)
Explanation of Solution
Given information:The table given below shows the gross revenue for Broadway season in different years:
| Broadway Season Revenue | |
| Year | Amount ($ millions) |
| 1994 | 406 |
| 1999 | 603 |
| 2004 | 769 |
| 2005 | 862 |
| 2006 | 939 |
| 2007 | 938 |
Graph:
From part (a), the quadratic regression equation for the Broadway Season Revenue is
Step 1: Press
Step 2: Press
Step 3: Press the keystrokes
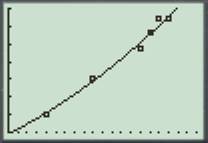
Figure (1)
Interpretation: From the graph it can be observed that the gross revenue for Broadway season in year 2008 is more than 1000 millions of dollars.
(c)
To find: The amount of gross revenue for the Broadway Season in year 2012.
(c)
Answer to Problem 54E
The amount of gross revenue for the Broadway Season in year 2012 is 1228.15 millions of dollars.
Explanation of Solution
Given information:The table given below shows the gross revenue for Broadway season in different years:
| Broadway Season Revenue | |
| Year | Amount ($ millions) |
| 1994 | 406 |
| 1999 | 603 |
| 2004 | 769 |
| 2005 | 862 |
| 2006 | 939 |
| 2007 | 938 |
Calculation:
From part (a), the quadratic regression equation for the Broadway Season Revenue is
Consider that
Substitute 22 for x in the quadratic regression equation.
Therefore, the amount of gross revenue for the Broadway Season in year 2012 is 1228.15 millions of dollars.
(d)
To find:The linear regression for the data given in the table for the gross revenue of Broadway season and the amount of revenue in 2012.
(d)
Answer to Problem 54E
The linear regression equation for the Broadway Season Revenue is
Explanation of Solution
Given information:The table given below shows the gross revenue for Broadway season in different years:
| Broadway Season Revenue | |
| Year | Amount ($ millions) |
| 1994 | 406 |
| 1999 | 603 |
| 2004 | 769 |
| 2005 | 862 |
| 2006 | 939 |
| 2007 | 938 |
Calculation:
To find the linear regression equation of the given data, use graphing calculator.
Press the keystrokes
Now, substitute 22 for x in the above equation to find the revenue in 2012.
Therefore, the linear regression equation for the Broadway Season Revenue is
Chapter 1 Solutions
Calculus 2012 Student Edition (by Finney/Demana/Waits/Kennedy)
Additional Math Textbook Solutions
Thinking Mathematically (6th Edition)
Elementary Statistics (13th Edition)
Introductory Statistics
Pre-Algebra Student Edition
Elementary Statistics: Picturing the World (7th Edition)
A First Course in Probability (10th Edition)


- AP CollegeBoard 3B Quiz 1. 2. y AP PRECALCULUS Name: od to dove (or) slog mig Test Boc 2л The figure gives the graphs of four functions labeled A, B, C, and D -1 in the xy-plane. Which is the graph of f(x) = 2 cos¹x ? m -3 π y 2- 1 3 (A) A (B) B 2 A B C D D -1- -2- Graph of f -2 -1 3. 2- y' Graph of g 1 2 1 3 y = R 2/01 y = 1 + 1/2 2 3 4 5 y= = 1-777 2 (C) C (D) D Which of the following defines g(x)? The figure gives the graphs of the functions ƒ and g in the xy-plane. The function f is given by f(x) = tan-1 EVES) (A) (A) tan¹x+1 (B) tan¹ x + 1/ (C) tan¹ (2) +1 (D) tan¹() + (B) Vs) a I.arrow_forwardConsider the region below f(x) = (11-x), above the x-axis, and between x = 0 and x = 11. Let x; be the midpoint of the ith subinterval. Complete parts a. and b. below. a. Approximate the area of the region using eleven rectangles. Use the midpoints of each subinterval for the heights of the rectangles. The area is approximately square units. (Type an integer or decimal.)arrow_forwardRama/Shutterstock.com Romaset/Shutterstock.com The power station has three different hydroelectric turbines, each with a known (and unique) power function that gives the amount of electric power generated as a function of the water flow arriving at the turbine. The incoming water can be apportioned in different volumes to each turbine, so the goal of this project is to determine how to distribute water among the turbines to give the maximum total energy production for any rate of flow. Using experimental evidence and Bernoulli's equation, the following quadratic models were determined for the power output of each turbine, along with the allowable flows of operation: 6 KW₁ = (-18.89 +0.1277Q1-4.08.10 Q) (170 - 1.6 · 10¯*Q) KW2 = (-24.51 +0.1358Q2-4.69-10 Q¹²) (170 — 1.6 · 10¯*Q) KW3 = (-27.02 +0.1380Q3 -3.84-10-5Q) (170 - 1.6-10-ºQ) where 250 Q1 <1110, 250 Q2 <1110, 250 <3 < 1225 Qi = flow through turbine i in cubic feet per second KW = power generated by turbine i in kilowattsarrow_forward
- uestion 10 of 12 A Your answer is incorrect. L 0/1 E This problem concerns hybrid cars such as the Toyota Prius that are powered by a gas-engine, electric-motor combination, but can also function in Electric-Vehicle (EV) only mode. The figure below shows the velocity, v, of a 2010 Prius Plug-in Hybrid Prototype operating in normal hybrid mode and EV-only mode, respectively, while accelerating from a stoplight. 1 80 (mph) Normal hybrid- 40 EV-only t (sec) 5 15 25 Assume two identical cars, one running in normal hybrid mode and one running in EV-only mode, accelerate together in a straight path from a stoplight. Approximately how far apart are the cars after 15 seconds? Round your answer to the nearest integer. The cars are 1 feet apart after 15 seconds. Q Search M 34 mlp CHarrow_forwardFind the volume of the region under the surface z = xy² and above the area bounded by x = y² and x-2y= 8. Round your answer to four decimal places.arrow_forwardУ Suppose that f(x, y) = · at which {(x, y) | 0≤ x ≤ 2,-x≤ y ≤√x}. 1+x D Q Then the double integral of f(x, y) over D is || | f(x, y)dxdy = | Round your answer to four decimal places.arrow_forward
- D The region D above can be describe in two ways. 1. If we visualize the region having "top" and "bottom" boundaries, express each as functions of and provide the interval of x-values that covers the entire region. "top" boundary 92(x) = | "bottom" boundary 91(x) = interval of values that covers the region = 2. If we visualize the region having "right" and "left" boundaries, express each as functions of y and provide the interval of y-values that covers the entire region. "right" boundary f2(y) = | "left" boundary fi(y) =| interval of y values that covers the region =arrow_forwardFind the volume of the region under the surface z = corners (0,0,0), (2,0,0) and (0,5, 0). Round your answer to one decimal place. 5x5 and above the triangle in the xy-plane witharrow_forwardGiven y = 4x and y = x² +3, describe the region for Type I and Type II. Type I 8. y + 2 -24 -1 1 2 2.5 X Type II N 1.5- x 1- 0.5 -0.5 -1 1 m y -2> 3 10arrow_forward
 Calculus: Early TranscendentalsCalculusISBN:9781285741550Author:James StewartPublisher:Cengage Learning
 Thomas' Calculus (14th Edition)CalculusISBN:9780134438986Author:Joel R. Hass, Christopher E. Heil, Maurice D. WeirPublisher:PEARSON
 Calculus: Early Transcendentals (3rd Edition)CalculusISBN:9780134763644Author:William L. Briggs, Lyle Cochran, Bernard Gillett, Eric SchulzPublisher:PEARSON
 Calculus: Early TranscendentalsCalculusISBN:9781319050740Author:Jon Rogawski, Colin Adams, Robert FranzosaPublisher:W. H. Freeman
 Calculus: Early Transcendental FunctionsCalculusISBN:9781337552516Author:Ron Larson, Bruce H. EdwardsPublisher:Cengage Learning