
(a)
Interpretation:
The liquidus temperature for NiO-MgO ceramic is to be determined.
Concept Introduction:
On the temperature-time graph of a ceramic, the first point where the deflection or the change in the slope of the cooling curve is seen is the liquidus temperature of that ceramic at which the first crystals in the ceramic can coexist with its melt in the
Answer to Problem 10.74P
Liquidus temperature,
Explanation of Solution
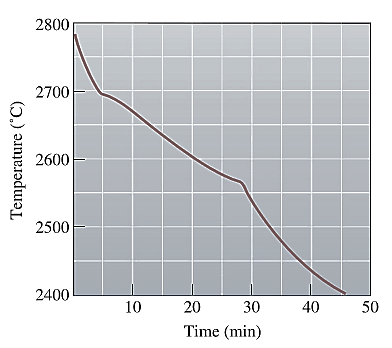
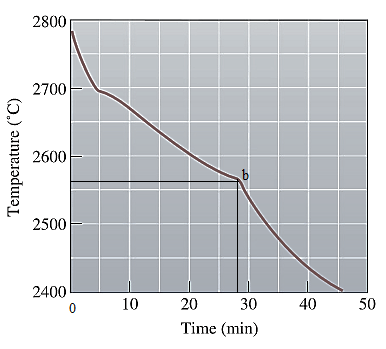
The cooling curve for the NiO-MgO system is shown below as:

The first change in the slope of the given cooling curve for NiO-MgO is shown below as:
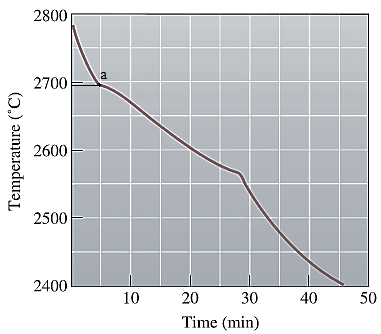
Liquidus temperature
(b)
Interpretation:
The solidus temperature for NiO-MgO ceramic is to be determined.
Concept Introduction:
On the temperature-time graph of a ceramic, the second point where the deflection or the change in the slope of the cooling curve is seen is the solidus temperature of that ceramic at which the crystals in the ceramic can coexist with its last liquid in the thermodynamic equilibrium.
Answer to Problem 10.74P
Solidus temperature,
Explanation of Solution
The cooling curve for the NiO-MgO system is shown below as:
The second change in the slope of the given cooling curve for NiO-MgO is shown below as:
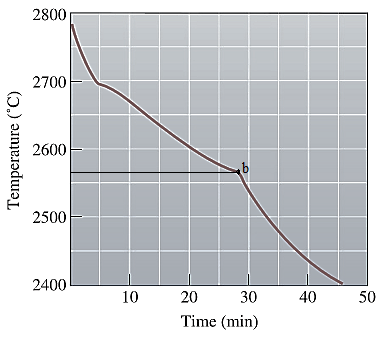
Solidus temperature
(c)
Interpretation:
The freezing range for NiO-MgO ceramic is to be determined.
Concept Introduction:
Freezing range for a ceramic is the difference of the liquidus and the solidus temperature of a ceramic. In this range, the ceramic melt starts to crystallize at liquidus temperature and solidifies when it reaches the solidus temperature.
Answer to Problem 10.74P
Freezing range,
Explanation of Solution
From part (a) and (b), the liquidus and solidus temperature for the given ceramic is determined as:
The freezing range (FR) for this ceramic composition will be:
(d)
Interpretation:
The pouring temperature of the NiO-MgO ceramic is to be determined.
Concept Introduction:
The temperature at which the material is poured into the cast and then allowed to cool thereafter is known as the pouring temperature.
On a cooling curve (temperature-time), pouring temperature is the starting point temperature.
Answer to Problem 10.74P
Pouring temperature,
Explanation of Solution
The cooling curve for the NiO-MgO system is shown below as:

From this curve, the temperature when the ceramic is poured to be casted is determined as:
(e)
Interpretation:
The superheat for the given NiO-MgO ceramic is to be determined.
Concept Introduction:
Superheat for a material is defined as the difference in the pouring temperature and the liquidus temperature of the casting material.
Answer to Problem 10.74P
Superheat is determined as
Explanation of Solution
From part (a) and (d), the liquidus and pouring temperature for the given ceramic is determined as:
The superheat for this ceramic composition will be:
(f)
Interpretation:
The local solidification time for the given NiO-MgO ceramic is to be determined.
Concept Introduction:
The time needed to only remove the latent heat of fusion in the casting at a particular location is known as the local solidification time. It is measured from the point of the start of the solidification until the end of it.
Answer to Problem 10.74P
Local solidification time is,
Explanation of Solution
The cooling curve for the NiO-MgO system is shown below as:

Solidification starts at the liquidus temperature and ends at the solidus temperature marked on the above graph as shown below:
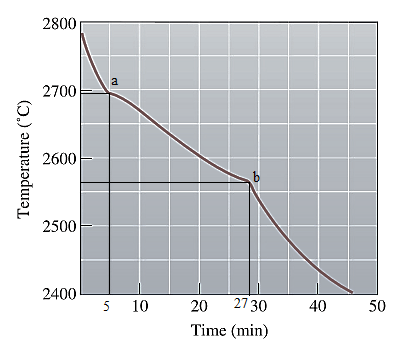
Point 'a' represents the liquidus temperature and the time when solidification starts is
Point 'b' represents the solidus temperature and the time at which solidification stops is
Local solidification time is now calculated as:
(g)
Interpretation:
The total solidification time for the given NiO-MgO ceramic is to be determined.
Concept Introduction:
The time needed to remove the latent heat of fusion as well as the specific heat of the liquid in the casting at a particular location is known as the total solidification time. It is measured from the time of pouring until the end of the solidification.
Answer to Problem 10.74P
Total solidification time is,
Explanation of Solution
The cooling curve for the NiO-MgO system is shown below as:

Time at the pouring temperature is
Point 'b' represents the solidus temperature and the time at which solidification stops is
Total solidification time is now calculated as:
(h)
Interpretation:
The composition of the given NiO-MgO ceramic is to be determined.
Concept Introduction:
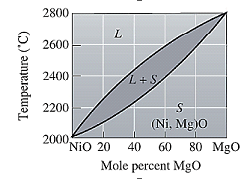
On the temperature-composition graph of a ceramic, the curve above which the ceramic exist in the liquid phase is the liquidus curve. The temperature at this curve is the maximum temperature at which the crystals in the ceramic can coexist with its melted form in the thermodynamic equilibrium.
Solidus curve is the locus of the temperature on the temperature composition graph of an alloy, beyond which the alloy is completely in solid phase. The temperature at this curve is minimum known as solidus temperature at which the crystals in the alloy can coexist with its melt in the thermodynamic equilibrium.
Answer to Problem 10.74P
Composition of the ceramic is
Explanation of Solution
The equilibrium phase diagram for the NiO-MgO system is shown below as:
From part (a) and (b), the liquidus and solidus temperature are determined as:
Mark both the temperatures on the NiO-MgO graph as shown below:
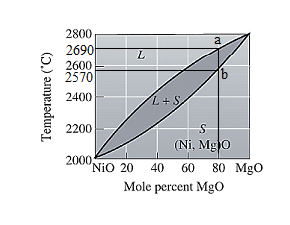
Point 'a' and 'b' both fall on the same composition of the ceramic which is
Want to see more full solutions like this?
Chapter 10 Solutions
Essentials Of Materials Science And Engineering

- PROBLEM 2.50 1.8 m The concrete post (E-25 GPa and a = 9.9 x 10°/°C) is reinforced with six steel bars, each of 22-mm diameter (E, = 200 GPa and a, = 11.7 x 10°/°C). Determine the normal stresses induced in the steel and in the concrete by a temperature rise of 35°C. 6c " 0.391 MPa 240 mm 240 mm 6₁ = -9.47 MPaarrow_forwardI need help on this question. step by step calculations and answers.arrow_forwardDon't use ai to answer I will report you answerarrow_forward
- jan G(f) f Sketch the spectrum of g(t), which has a maximum frequency of 5 kHz, if it is sampled at the following sampling frequencies: 7 kHz, 10 kHz and 15 kHz. Indicate if and how the signal can be recovered at each sampling frequency.arrow_forwardDon't use ai to answer i will report your answerarrow_forwardA single tone is modulated using FM transmitter. The SNR, at the input of the demodulator 20 dB. If the maximum frequency of the modulating signal is 4 kHz, and the maximum equency deviation is 12 kHz, find the SNR, and the bandwidth (using Carson rule) at the ollowing conditions: . For the given values of fm and Af. !. If the amplitude of the modulating signal is increased by 80%. 3. If the amplitude of the modulating signal is decreased by 50%, and frequency of modulating signal is increased by 50%.arrow_forward
- The circuit shown below on the left has the following parameters: V₁ = 5 V. R₁ = 40, R₂ = 40, α = 0.1. This circuit can be replaced by an equivalent circuit shown below on the right such that the voltage and current received by an arbitrary load resistor RL, are identical when connected to either circuits. Determine the value of the resistor R (in ) in the equivalent circuit. R₁ Rx R2 R₁ Vx R₁ Vi απ. barrow_forwardLab 07: Java Graphics (Bonus lab) In this lab, we'll be practicing what we learned about GUIs, and Mouse events. You will need to implement the following: ➤ A GUI with a drawing panel. We can click in this panel, and you will capture those clicks as a Point (see java.awt.Point) in a PointCollection class (you need to build this). о The points need to be represented by circles. Below the drawing panel, you will need 5 buttons: о An input button to register your mouse to the drawing panel. ○ о о A show button to paint the points in your collection on the drawing panel. A button to shift all the points to the left by 50 pixels. The x position of the points is not allowed to go below zero. Another button to shift all the points to the right 50 pixels. The x position of the points cannot go further than the You can implement this GUI in any way you choose. I suggest using the BorderLayout for a panel containing the buttons, and a GridLayout to hold the drawing panel and button panels.…arrow_forwardK/S 46. (O المهمات الجديدة 0 المنتهية 12 المغـ ۱۱:۰۹ search ليس لديك اي مهمات ☐ ○ ☑arrow_forward
- the answer should be: V2= -(P0-PL/2μL)(dx-x^)+Ux/darrow_forwardFor some viscoelastic polymers that are subjected to stress relaxation tests, the stress decays with time according to a(t) = a(0) exp(-4) (15.10) where σ(t) and o(0) represent the time-dependent and initial (i.e., time = 0) stresses, respectively, and t and T denote elapsed time and the relaxation time, respectively; T is a time-independent constant characteristic of the material. A specimen of a viscoelastic polymer whose stress relaxation obeys Equation 15.10 was suddenly pulled in tension to a measured strain of 0.5; the stress necessary to maintain this constant strain was measured as a function of time. Determine E (10) for this material if the initial stress level was 3.5 MPa (500 psi), which dropped to 0.5 MPa (70 psi) after 30 s.arrow_forward1. Consider the following a unity feedback control system. R(s) + E(s) 500(s+2)(s+5)(s+6) s(s+8)(s+10)(s+12) -Y(s) Find the followings: a) Type of the system b) Static position error constant Kp, Static velocity error constant Ry and Static acceleration error constant Ka c) Find the steady-state error of the system for (i) step input 1(t), (ii) ramp input t 1(t), (iii) parabolic input t² 1(t). 2. Repeat the above problem for the following system. R(s) + E(s) 500(s + 2)(s + 5) (s+8)(s+ 10)(s+12) Y(s) 3. Repeat the above problem for the following system. R(s) + E(s) 500(s+2)(s+4)(s+5)(s+6)(s+7) s²(s+8)(s+10)(s+12) Y(s)arrow_forward
 MATLAB: An Introduction with ApplicationsEngineeringISBN:9781119256830Author:Amos GilatPublisher:John Wiley & Sons Inc
 Essentials Of Materials Science And EngineeringEngineeringISBN:9781337385497Author:WRIGHT, Wendelin J.Publisher:Cengage,
 Industrial Motor ControlEngineeringISBN:9781133691808Author:Stephen HermanPublisher:Cengage Learning
 Basics Of Engineering EconomyEngineeringISBN:9780073376356Author:Leland Blank, Anthony TarquinPublisher:MCGRAW-HILL HIGHER EDUCATION
 Structural Steel Design (6th Edition)EngineeringISBN:9780134589657Author:Jack C. McCormac, Stephen F. CsernakPublisher:PEARSON
 Fundamentals of Materials Science and Engineering...EngineeringISBN:9781119175483Author:William D. Callister Jr., David G. RethwischPublisher:WILEY