
(a)
Interpretation:
The liquidus temperature for
Concept Introduction:
On the temperature-composition graph of a ceramic, the curve above which the ceramic exist in the liquid phase is the liquidus curve. The temperature at this curve is maximum known as liquidus temperature at which the crystals in the ceramic can coexist with its melt in the
Answer to Problem 10.73P
Liquidus temperature,
Explanation of Solution
The equilibrium phase diagram for the MgO-FeO system is shown below as:
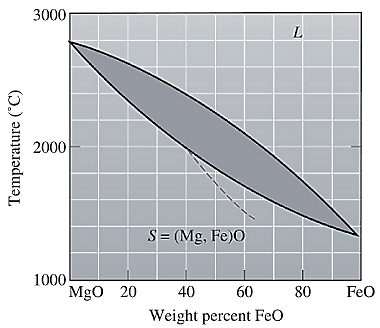
A straight line from
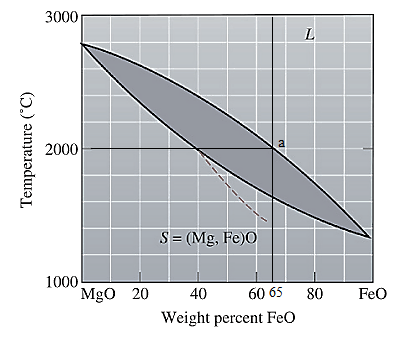
Liquidus temperature
(b)
Interpretation:
The solidus temperature for
Concept Introduction:
Solidus curve is the locus of the temperature on the temperature composition graph of a ceramic, beyond which the ceramic is completely in solid phase. The temperature at this curve is minimum known as solidus temperature at which the crystals in the ceramic can coexist with its melt in the thermodynamic equilibrium.
Answer to Problem 10.73P
Solidus temperature,
Explanation of Solution
The equilibrium phase diagram for the MgO-FeO system is shown below as:
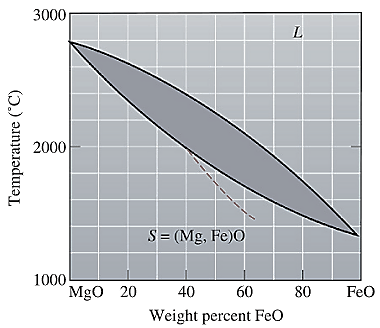
A straight line from
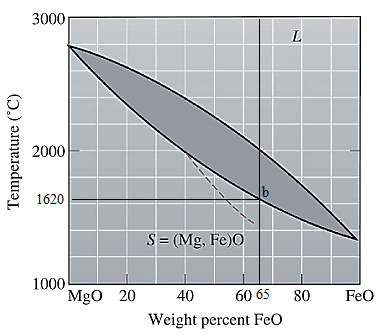
Solidus temperature
(c)
Interpretation:
The freezing range for
Concept Introduction:
Freezing range for a ceramic is the difference of the liquidus and the solidus temperature of a ceramic. In this range, the ceramic melt starts to crystallize at liquidus temperature and solidifies when reaches solidus temperature.
Answer to Problem 10.73P
Freezing range,
Explanation of Solution
From part (a) and (b), the liquidus and solidus temperature for the given ceramic is determined as:
The freezing range (FR) for this ceramic composition will be:
(d)
Interpretation:
The composition of the first solid that is formed when
Concept Introduction:
On the temperature-composition graph of a ceramic, the curve above which the ceramic exist in the liquid phase is the liquidus curve. The temperature at this curve is maximum known as liquidus temperature at which the crystals in the ceramic can coexist with its melt in the thermodynamic equilibrium.
Answer to Problem 10.73P
The composition of the first solid formed is
Explanation of Solution
The equilibrium phase diagram for the MgO-FeO system is shown below as:
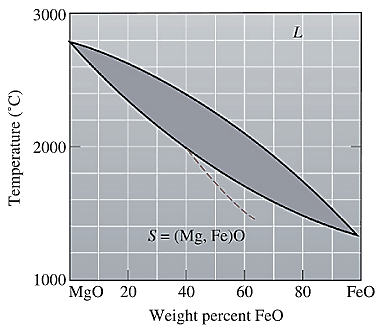
A straight line from
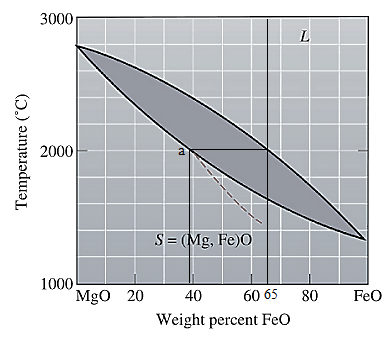
Point 'a' represents the composition of the first solid which is formed when
(e)
Interpretation:
The composition of the last liquid which is solidified when
Concept Introduction:
On the temperature-composition graph of a ceramic, the curve above which the ceramic exist in the liquid phase is the liquidus curve. The temperature at this curve is maximum known as liquidus temperature at which the crystals in the ceramic can coexist with its melt in the thermodynamic equilibrium.
Solidus curve is the locus of the temperature on the temperature composition graph of a ceramic, beyond which the ceramic is completely in solid phase.
Between the solidus and liquidus curve, the ceramic exits in a slurry form in which there is both crystals as well as ceramic melt.
Solidus temperature is always less than or equal to the liquidus temperature.
Answer to Problem 10.73P
The composition of the last liquid solidified is
Explanation of Solution
The equilibrium phase diagram for the MgO-FeO system is shown below as:
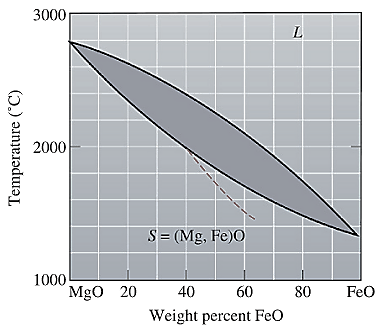
A straight line from
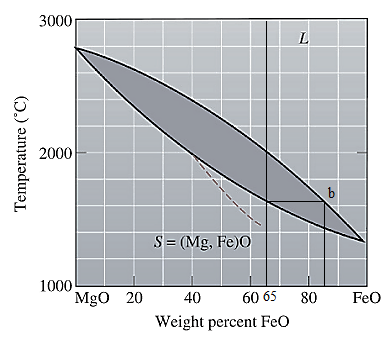
Point 'b' represents the composition of the last liquid which solidify when
(f)
Interpretation:
The phases present, their compositions and their amounts for
Concept Introduction:
On the temperature-composition graph of a ceramic, the curve above which the ceramic exist in the liquid phase is the liquidus curve. The temperature at this curve is the maximum temperature at which the crystals in the ceramic can coexist with its melt in the thermodynamic equilibrium.
Solidus curve is the locus of the temperature on the temperature composition graph of a ceramic, beyond which the ceramic is completely in solid phase.
Between the solidus and liquidus curve, the ceramic exits in a slurry form in which there is both crystals as well as ceramic melt.
Solidus temperature is always less than or equal to the liquidus temperature.
Amount of each phase in wt% is calculated using lever rule. At a particular temperature and ceramic composition, a tie line is drawn on the phase diagram of the ceramic between the solidus and liquidus curve. Then the portion of the lever opposite to the phase whose amount is to be calculated is considered in the formula used as:
Answer to Problem 10.73P
Both solid as well as liquid phases are present at the given conditions.
Composition of the liquid phase present is
Composition of the solid phase present is
Amount of the liquid phase is
Amount of the solid phase is
Explanation of Solution
The equilibrium phase diagram for the MgO-FeO system is shown below as:
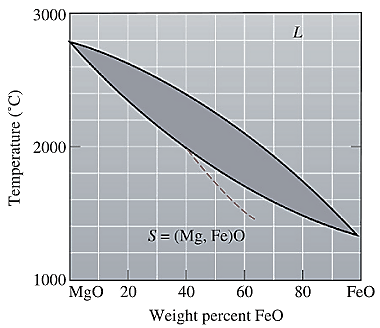
Now, draw a straight line from
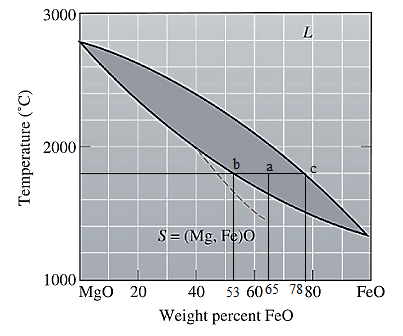
Both the phases, solid and liquid are present at this condition. Point 'b' represents the liquid phase composition in wt% and point 'c' represents the solid phase composition in wt%. From the above phase diagram:
To calculate amount of liquid phase, lever 'ac' will be used and to calculate amount of solid phase, lever 'ba' will be used. Use equation (1) to calculate the amount of each phase as:
(g)
Interpretation:
The phases present, their compositions and their amounts for
Concept Introduction:
On the temperature-composition graph of a ceramic, the curve above which the ceramic exist in the liquid phase is the liquidus curve. The temperature at this curve is the maximum temperature at which the crystals in the ceramic can coexist with its melt in the thermodynamic equilibrium.
Solidus curve is the locus of the temperature on the temperature composition graph of a ceramic, beyond which the ceramic is completely in solid phase.
Between the solidus and liquidus curve, the ceramic exits in a slurry form in which there is both crystals as well as ceramic melt.
Solidus temperature is always less than or equal to the liquidus temperature.
Amount of each phase in wt% is calculated using lever rule. At a particular temperature and ceramic composition, a tie line is drawn on the phase diagram of the ceramic between the solidus and liquidus curve. Then the portion of the lever opposite to the phase whose amount is to be calculated is considered in the formula used as:
Answer to Problem 10.73P
Explanation of Solution
The equilibrium phase diagram for the MgO-FeO system is shown below as:
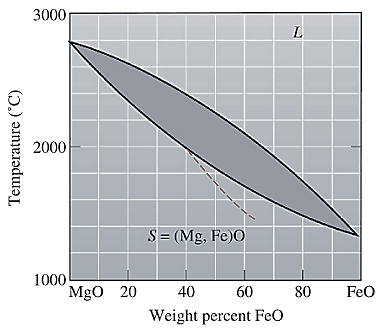
Now, draw a straight line from
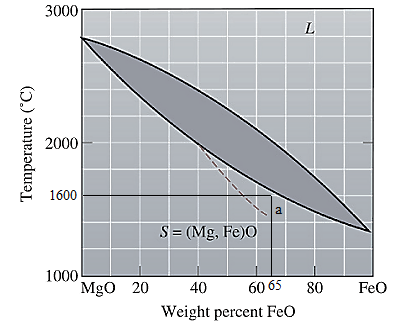
At this point 'a', only one phase is present which is solid, and it has
Want to see more full solutions like this?
Chapter 10 Solutions
Essentials Of Materials Science And Engineering
- I am looking for schematic ideas or recommendations for designing the required step-down system. Since the input is a 600V DC supply, a DC-DC converter may be necessary, as transformers are typically used for AC voltage. Key considerations would include: Voltage regulation: Ensuring a stable and consistent 120V DC output.Component selection: Choosing appropriate DC-DC converter modules, capacitors for filtering, and protective components such as fuses or circuit breakers.Lighting system: Recommendations on energy-efficient lighting options like LEDs, which work well with DC power and offer durability for railway applications.Thermal management: Addressing heat dissipation within the converter and lighting circuit.Safety and standards: Complying with safety regulations for electrical systems in railways. I would greatly appreciate detailed insights into the design process, including key circuit components and configurations, as well as any schematic diagrams or references.arrow_forward1 2. For the following closed-loop system, G(s) = and H(s) = ½ (s+4)(s+6) a. Please draw the root locus by hand and mark the root locus with arrows. Calculate the origin and angle for asymptotes. b. Use Matlab to draw the root locus to verify your sketch. Input R(s) Output C(s) KG(s) H(s)arrow_forward1. In the following unity feedback system, we have G(s) = R(s) + K(s + 1) s(s + 2)(s +5) G(s) C(s) use Routh-Hurwitz stability criterion to find the range of K for the stability of the system.arrow_forward
- As shown in the figure below, moist air at T₁ = 36°C, 1 bar, and 35% relative humidity enters a heat exchanger operating at steady state with a volumetric flow rate of 10 m³/min and is cooled at constant pressure to 22°C. Ignoring kinetic and potential energy effects, determine: (a) the dew point temperature at the inlet, in °C. (b) the mass flow rate of moist air at the exit, in kg/min. (c) the relative humidity at the exit. (d) the rate of heat transfer from the moist air stream, in kW. (AV)1, T1 P₁ = 1 bar 11 = 35% 120 T₂=22°C P2 = 1 bararrow_forwardWhat is the current flowing through the load resistor, RL (in ARMS)? How much power does the voltage source, V1, provide to the circuit? The magnitude of V1 is given in VRMS.arrow_forwardThis week we will be building a regression model conceptually for our discussion assignment. Consider your current workplace (or previous/future workplace if not currently working) and answer the following set of questions. Expand where needed to help others understand your thinking: What is the most important factor (variable) that needs to be predicted accurately at work? Why? Justify its selection as your dependent variable.arrow_forward
- According to best practices, you should always make a copy of a config file and add a date to filename before editing? Explain why this should be done and what could be the pitfalls of not doing it.arrow_forwardWe wish to power an extremely bright light to communicate with a neighbor using morse code. We let the system run 24/7, but we swap out the battery every 24 hours for a fully charged one and recharge the drained battery with a solar charger. Based on the signal we are sending, the light draws 2.5 A of current for 2 seconds every 5 seconds. As well, the computer sending the signal to the light continuously draws 120 mA. A 12 V lead acid battery is used to provide the power. To preserve the longevity of the battery we wish to keep the lower limit of the SoC to 75%. (a) What is the minimum battery capacity in Ah required? (b) If a 60 W 12 V solar panel was used to recharge the battery, noting that we will keep the lower SoC to 75%, how many hours of adequate sunlight would be needed each day? (c) If the solar charger malfunctions, and we are forced to use one battery without recharging, what would the battery’s SoC be after 2 days?arrow_forwardPROBLEM:7–23. Determine the maximum shear stress acting in the beam at the critical section where the internal shear force is maximum. 3 kip/ft ΑΟ 6 ft DiC 0.75 in. 6 ft 6 in. 1 in. F [ 4 in. C 4 in. D 6 in. Fig of prob:7-23 1 in. 6 ft Barrow_forward
- 1. In the following unity feedback system, we have G(s) = R(s) + K(s + 1) s(s + 2)(s +5) G(s) C(s) use Routh-Hurwitz stability criterion to find the range of K for the stability of the system.arrow_forwardDon't use ai to answer i will report your answerarrow_forwardAir at T₁-24°C, p₁-1 bar, 50% relative humidity enters an insulated chamber operating at steady state with a mass flow rate of 3 kg/min and mixes with a saturated moist air stream entering at T₂-7°C, p2-1 bar. A single mixed stream exits at T3-17°C, p3-1 bar. Neglect kinetic and potential energy effects Step 1 Your answer is correct. Determine mass flow rate of the moist air entering at state 2, in kg/min. m2 = 2.1 Hint kg/min Using multiple attempts will impact your score. 5% score reduction after attempt 2 Step 2 Determine the relative humidity of the exiting stream. Փ3 = i % Attempts: 1 of 3 usedarrow_forward
 MATLAB: An Introduction with ApplicationsEngineeringISBN:9781119256830Author:Amos GilatPublisher:John Wiley & Sons Inc
 Essentials Of Materials Science And EngineeringEngineeringISBN:9781337385497Author:WRIGHT, Wendelin J.Publisher:Cengage,
 Industrial Motor ControlEngineeringISBN:9781133691808Author:Stephen HermanPublisher:Cengage Learning
 Basics Of Engineering EconomyEngineeringISBN:9780073376356Author:Leland Blank, Anthony TarquinPublisher:MCGRAW-HILL HIGHER EDUCATION
 Structural Steel Design (6th Edition)EngineeringISBN:9780134589657Author:Jack C. McCormac, Stephen F. CsernakPublisher:PEARSON
 Fundamentals of Materials Science and Engineering...EngineeringISBN:9781119175483Author:William D. Callister Jr., David G. RethwischPublisher:WILEY


