
(a)
Interpretation:
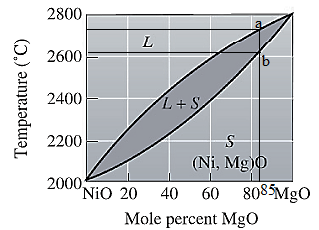
The liquidus temperature, solidus temperature, and freezing range for NiO-
Concept Introduction:
On the temperature-composition graph of an alloy, the curve above which the alloy exist in the liquid phase is the liquidus curve. The temperature at this curve is maximum known as liquidus temperature at which the crystals in the alloy can coexist with its melt in the
Solidus curve is the locus of the temperature on the temperature composition graph of an alloy, beyond which the alloy is completely in solid phase. The temperature at this curve is minimum known as solidus temperature at which the crystals in the alloy can coexist with its melt in the thermodynamic equilibrium.
Freezing range for an alloy is the difference of the liquidus and the solidus temperature of an alloy. In this range, the alloy melt starts to crystallize at liquidus temperature and solidifies when reaches solidus temperature.
Answer to Problem 10.44P
Liquidus temperature,
Solidus temperature,
Freezing range,
Explanation of Solution
The equilibrium phase diagram for the NiO-MgO system is shown below as:

For NiO-
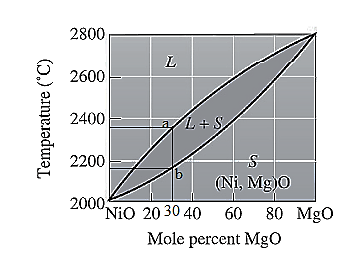
The freezing range (FR) for this ceramic composition will be:
(b)
Interpretation:
The liquidus temperature, solidus temperature, and freezing range for NiO-
Concept Introduction:
On the temperature-composition graph of an alloy, the curve above which the alloy exist in the liquid phase is the liquidus curve. The temperature at this curve is maximum known as liquidus temperature at which the crystals in the alloy can coexist with its melt in the thermodynamic equilibrium.
Solidus curve is the locus of the temperature on the temperature composition graph of an alloy, beyond which the alloy is completely in solid phase. The temperature at this curve is minimum known as solidus temperature at which the crystals in the alloy can coexist with its melt in the thermodynamic equilibrium.
Freezing range for an alloy is the difference of the liquidus and the solidus temperature of an alloy. In this range, the alloy melt starts to crystallize at liquidus temperature and solidifies when reaches solidus temperature.
Answer to Problem 10.44P
Liquidus temperature,
Solidus temperature,
Freezing range,
Explanation of Solution
The equilibrium phase diagram for the NiO-MgO system is shown below as:

For NiO-
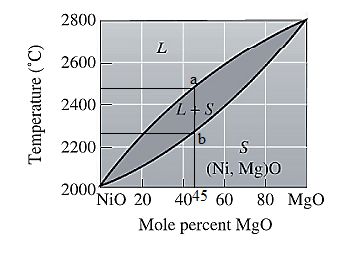
The freezing range (FR) for this ceramic composition will be:
(c)
Interpretation:
The liquidus temperature, solidus temperature, and freezing range for NiO-
Concept Introduction:
On the temperature-composition graph of an alloy, the curve above which the alloy exist in the liquid phase is the liquidus curve. The temperature at this curve is maximum known as liquidus temperature at which the crystals in the alloy can coexist with its melt in the thermodynamic equilibrium.
Solidus curve is the locus of the temperature on the temperature composition graph of an alloy, beyond which the alloy is completely in solid phase. The temperature at this curve is minimum known as solidus temperature at which the crystals in the alloy can coexist with its melt in the thermodynamic equilibrium.
Freezing range for an alloy is the difference of the liquidus and the solidus temperature of an alloy. In this range, the alloy melt starts to crystallize at liquidus temperature and solidifies when reaches solidus temperature.
Answer to Problem 10.44P
Liquidus temperature,
Solidus temperature,
Freezing range,
Explanation of Solution
The equilibrium phase diagram for the NiO-MgO system is shown below as:

For NiO-
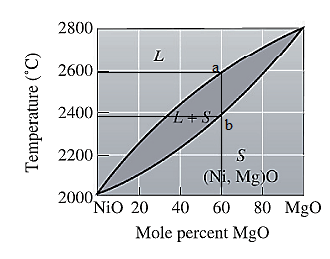
The freezing range (FR) for this ceramic composition will be:
(d)
Interpretation:
The liquidus temperature, solidus temperature, and freezing range for NiO-
Concept Introduction:
On the temperature-composition graph of an alloy, the curve above which the alloy exist in the liquid phase is the liquidus curve. The temperature at this curve is maximum known as liquidus temperature at which the crystals in the alloy can coexist with its melt in the thermodynamic equilibrium.
Solidus curve is the locus of the temperature on the temperature composition graph of an alloy, beyond which the alloy is completely in solid phase. The temperature at this curve is minimum known as solidus temperature at which the crystals in the alloy can coexist with its melt in the thermodynamic equilibrium.
Freezing range for an alloy is the difference of the liquidus and the solidus temperature of an alloy. In this range, the alloy melt starts to crystallize at liquidus temperature and solidifies when reaches solidus temperature.
Answer to Problem 10.44P
Liquidus temperature,
Solidus temperature,
Freezing range,
Explanation of Solution
The equilibrium phase diagram for the NiO-MgO system is shown below as:
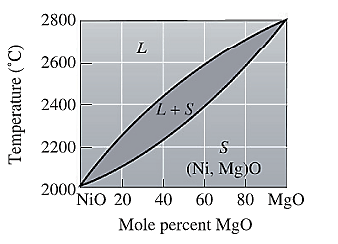
For NiO-
The freezing range (FR) for this ceramic composition will be:
Want to see more full solutions like this?
Chapter 10 Solutions
Essentials Of Materials Science And Engineering

- This is an old practice exam. The answer is Ta-a = 4.615 MPa max = 14.20 MPa Su = 31.24 MPa Sus = 10.15 MPa but why?arrow_forwardI need help with this problem and an step by step explanation of the solution from the image described below. (Introduction to Signals and Systems)arrow_forward10.49 Using source transformation, find i in the circuit of Fig. 10.94. 5 Ω www 3Ω 5 mH 8 sin(200t+30°) A 1 mFarrow_forward
- This is an old practice exam. The answer is dmin = 42.33 mm but how?arrow_forward5.) 12.124* - Block B (WB = 12 lb) rests as shown on the upper surface of wedge A (W₁ = 30 lb). The angle of the slope is 0 = 30°. Neglect friction, and find immediately after the system is released from rest (a) the acceleration of a (a) and (b) the acceleration of B relative to A (a B/A).arrow_forwardI need help to solve a simple problem using Grover’s algorithm, where the solution is not necessarily known beforehand. The problem is a 2×2 binary sudoku with two rules: • No column may contain the same value twice. • No row may contain the same value twice. Each square in the sudoku is assigned to a variable as follows: We want to design a quantum circuit that outputs a valid solution to this sudoku. While using Grover’s algorithm for this task is not necessarily practical, the goal is to demonstrate how classical decision problems can be converted into oracles for Grover’s algorithm. Turning the Problem into a Circuit To solve this, an oracle needs to be created that helps identify valid solutions. The first step is to construct a classical function within a quantum circuit that checks whether a given state satisfies the sudoku rules. Since we need to check both columns and rows, there are four conditions to verify: v0 ≠ v1 # Check top row v2 ≠ v3 # Check bottom row…arrow_forward
- This exam is closed book, but you may use one 8.5x11" sheet of notes (both sides), handwritten by you Wote all answers kot on this test paper! Use the personal key number N (written above) on the parameters se fix to Show your work and explain your reasoning Partial credit will be given for partial solutions. When giving a numerical answer, specify units ill any apply. No credit will be given for solving problems from previous 1. For the AM signal with periodic message m() shown in Fig. 1 and modulation index = 0.03A a) find the carrier amplitude and carrier power; b) find the sideband power and compute the power efficiency & N = 15 4+N AA -(4+N) Fig. 1 r(s)→arrow_forward1. Tests of a 10 kVA, 230/2300 V single-phase transformer have yielded the following results: Vacuum test low voltage side: current = 0.45A Po = 70WLow side short circuit test: voltage = 11.6V Pcc = 224.3WDetermine: a. Parameters Rcc and Xcc of the equivalent circuit referring to the secondary.b. Transformer voltage regulation, if feeding a load of 4kVA, fp = 0.75 in delayc. Efficiency if the load is 7kVA, fp = 0.8 inductiveperform the calculations without using artificial intelligence, let it be by one of the assigned people pleasearrow_forwardWhat is the Maximum Bending Moment induced in the following Beam, if? P = 19 KN L = 11 m Ensure that your answer is in kN.m. لا اللهarrow_forward
- What is the Magnitude of the Maximum Stress in the beam below if? W。 = 6 kN/m L = 9 m Beam width, b = 226 mm Beam Height, h = 273 mm Give your answer in MPa. A 233 B 4|3 Woarrow_forward= 5. Design an Armstrong indirect FM modulator that generates an FM signal with a carrier frequency of (60+2M) MHz and Af 30 kHz. Use a narrowband FM generator with f. 200 kHz and Af= 12 Hz. The local oscillator must operate at a frequency in the range of 5-8 MHz, and frequency doublers, triplers, and quintuplers are available. Sketch the block diagram of your design, including values of all relevant parameters.arrow_forward4. The system shown below must recover both messages from the frequency-division multiplexed signal whose spectrum is input to it. a) Determine the frequency of the local oscillator; b) determine the bandwidths B, and B2 of the two low-pass filters; and c) sketch the spectra of the output signals, numbering key points on the frequency & amplitude axes. 艹 f(kHz) Wipw -12V 4 cos(27fLal) LPF1 MS) LPF2 MSarrow_forward
 MATLAB: An Introduction with ApplicationsEngineeringISBN:9781119256830Author:Amos GilatPublisher:John Wiley & Sons Inc
 Essentials Of Materials Science And EngineeringEngineeringISBN:9781337385497Author:WRIGHT, Wendelin J.Publisher:Cengage,
 Industrial Motor ControlEngineeringISBN:9781133691808Author:Stephen HermanPublisher:Cengage Learning
 Basics Of Engineering EconomyEngineeringISBN:9780073376356Author:Leland Blank, Anthony TarquinPublisher:MCGRAW-HILL HIGHER EDUCATION
 Structural Steel Design (6th Edition)EngineeringISBN:9780134589657Author:Jack C. McCormac, Stephen F. CsernakPublisher:PEARSON
 Fundamentals of Materials Science and Engineering...EngineeringISBN:9781119175483Author:William D. Callister Jr., David G. RethwischPublisher:WILEY