
(a)
Interpretation:
The liquidus temperature for
Concept Introduction:
On the temperature-composition graph of analloy, the curve above which the alloy exist in the liquid phase is the liquidus curve. The temperature at this curve is maximum known as liquidus temperature at which the crystals in the alloy can coexist with its melt in the
Answer to Problem 10.75P
Liquidus temperature,
Explanation of Solution
The equilibrium phase diagram for the Nb-W system is shown below as:

A straight line from
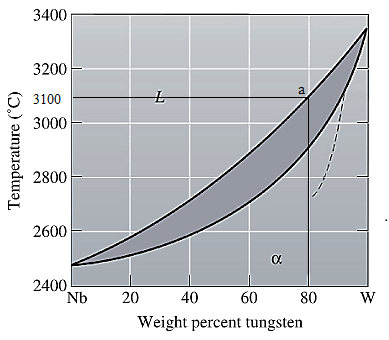
Liquidus temperature
(b)
Interpretation:
The solidus temperature for
Concept Introduction:
Solidus curve is the locus of the temperature on the temperature composition graph of analloy, beyond which the alloy is completely in solid phase. The temperature at this curve is minimum known as solidus temperature at which the crystals in the alloy can coexist with its melt in the thermodynamic equilibrium.
Answer to Problem 10.75P
Solidus temperature,
Explanation of Solution
The equilibrium phase diagram for the Nb-W system is shown below as:

A straight line from
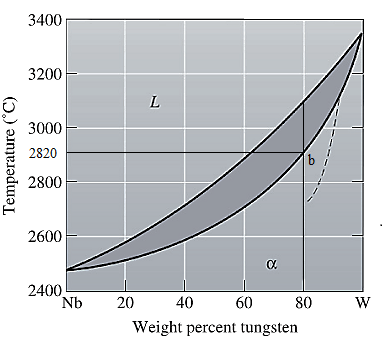
Solidus temperature
(c)
Interpretation:
The freezing range for
Concept Introduction:
Freezing range for analloy is the difference of the liquidus and the solidus temperature of analloy. In this range, the alloy melt starts to crystallize at liquidus temperature and solidifies when reaches solidus temperature.
Answer to Problem 10.75P
Freezing range,
Explanation of Solution
From part (a) and (b), the liquidus and solidus temperature for the given alloy is determined as:
The freezing range (FR) for this alloy composition will be:
(d)
Interpretation:
The composition of the first solid that is formed when
Concept Introduction:
On the temperature-composition graph of analloy, the curve above which the alloy exist in the liquid phase is the liquidus curve. The temperature at this curve is maximum known as liquidus temperature at which the crystals in the alloy can coexist with its melt in the thermodynamic equilibrium.
Answer to Problem 10.75P
The composition of the first solid formed is
Explanation of Solution
The equilibrium phase diagram for the Nb-W system is shown below as:

A straight line from
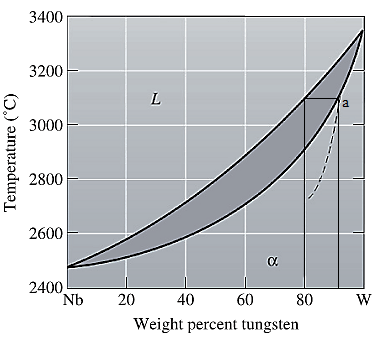
Point 'a' represents the composition of the first solid which is formed when
(e)
Interpretation:
The composition of the last liquid which is solidified when
Concept Introduction:
On the temperature-composition graph of analloy, the curve above which the alloy exist in the liquid phase is the liquidus curve. The temperature at this curve is maximum known as liquidus temperature at which the crystals in the alloy can coexist with its melt in the thermodynamic equilibrium.
Solidus curve is the locus of the temperature on the temperature composition graph of analloy, beyond which the alloy is completely in solid phase.
Between the solidus and liquidus curve, the alloy exits in a slurry form in which there is both crystals as well as alloy melt.
Solidus temperature is always less than or equal to the liquidus temperature.
Answer to Problem 10.75P
The composition of the last liquid solidified is
Explanation of Solution
The equilibrium phase diagram for the Nb-W system is shown below as:
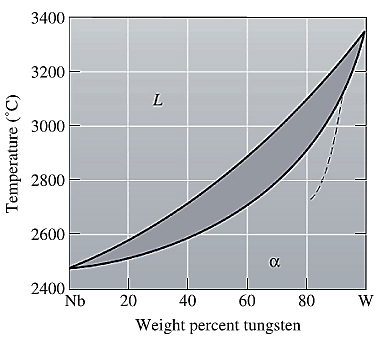
A straight line from
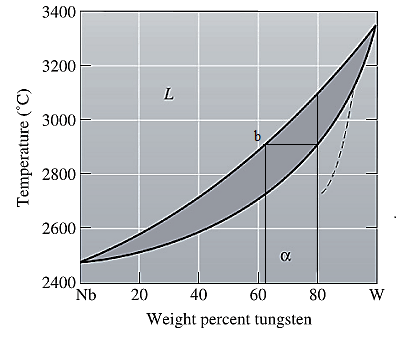
Point 'b' represents the composition of the last liquid which solidify when
(f)
Interpretation:
The phases present, their compositions and their amounts for
Concept Introduction:
On the temperature-composition graph of analloy, the curve above which the alloy exist in the liquid phase is the liquidus curve. The temperature at this curve is the maximum temperature at which the crystals in the alloy can coexist with its melt in the thermodynamic equilibrium.
Solidus curve is the locus of the temperature on the temperature composition graph of analloy, beyond which the alloy is completely in solid phase.
Between the solidus and liquidus curve, the alloy exits in a slurry form in which there is both crystals as well as alloy melt.
Solidus temperature is always less than or equal to the liquidus temperature.
Amount of each phase in wt% is calculated using lever rule. At a particular temperature and alloy composition, a tie line is drawn on the phase diagram of the alloy between the solidus and liquidus curve. Then the portion of the lever opposite to the phase whose amount is to be calculated is considered in the formula used as:
Answer to Problem 10.75P
Both solid as well as liquid phases are present at the given conditions.
Composition of the liquid phase present is
Composition of the solid phase present is
Amount of the liquid phase is
Amount of the solid phase is
Explanation of Solution
The equilibrium phase diagram for the Nb-W system is shown below as:

Now, draw a straight line from
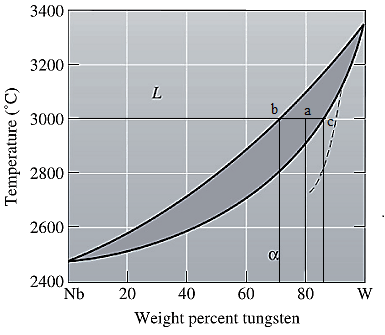
Both the phases, solid and liquid are present at this condition. Point 'b' represents the liquid phase composition in wt% and point 'c' represents the solid phase composition in wt%. From the above phase diagram:
To calculate amount of liquid phase, lever 'ac' will be used and to calculate amount of solid phase, lever 'ba' will be used. Use equation (1) to calculate the amount of each phase as:
(g)
Interpretation:
The phases present, their compositions and their amounts for
Concept Introduction:
On the temperature-composition graph of an alloy, the curve above which the alloy exists in the liquid phase is the liquidus curve. The temperature at this curve is the maximum temperature at which the crystals in the alloy can coexist with its melt in the thermodynamic equilibrium.
Solidus curve is the locus of the temperature on the temperature composition graph of analloy, beyond which the alloy is completely in solid phase.
Between the solidus and liquidus curve, the alloy exits in a slurry form in which there is both crystals as well as alloy melt.
Solidus temperature is always less than or equal to the liquidus temperature.
Amount of each phase in wt% is calculated using lever rule. At a particular temperature and alloy composition, a tie line is drawn on the phase diagram of the alloy between the solidus and liquidus curve. Then the portion of the lever opposite to the phase whose amount is to be calculated is considered in the formula used as:
Answer to Problem 10.75P
Explanation of Solution
The equilibrium phase diagram for the Nb-W system is shown below as:

Now, draw a straight line from
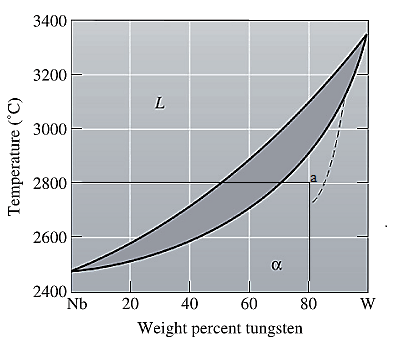
At this point 'a', only one phase is present which is solid, and it has
Want to see more full solutions like this?
Chapter 10 Solutions
Essentials Of Materials Science And Engineering

- P 4.4-22 Determine the values of the node voltages V1, V2, and v3 for the circuit shown in Figure P 4.4-22. 202 ww 4ia 202 w + + ±12 V V₁ ΖΩ V2 ΖΩ V3 11 A + 하arrow_forward3. A 15% magnesium chloride solution is flowing through a 5-nom sch 40 commercial steel pipe at a rate of 325,000 lbm/h. The average temperature of the magnesium chloride solution as it flows through the pipe is 10°F. Determine the convective heat transfer coefficient inside the pipe.arrow_forward3. An inifinite sheet of charge density of 3 nC/m² is located at x=-1m. An infinite line of charge density 1 nC/m is parallel to the the z-axis and intersect the y-axis at y=-1m. (a) What is the electric field vector at (0, 0, 0), assuming & = ε0? (b) What is the region in space where the field is zero?arrow_forward
- I would like help to resolve the following case, thank youarrow_forwardI need help with the following casearrow_forward2. Jojoba oil is flowing through a ¾-nom stainless steel pipe at a flow rate of 1,850 lbm/h. After the velocity profile in the pipe is fully developed, the oil enters a heater, as shown in Figure P5.7. The length of the heater section is 5 ft. The properties of the jojoba oil at the average temperature in the heater section are given in Table P5.7. Determine the convective heat transfer coefficient inside the heater section of the pipe. ¾ nom stainless steel pipe Heater section L=5ft Fig. P5.7 TABLE P5.7 Thermophysical Properties of Jojoba Oil at the Average Temperature in the Heater P (lbm/ft³) 68.671 (Btu/lbm-R) 0.30339 μ (lbm/ft-s) 0.012095 k (Btu/h-ft-°F) 0.077424arrow_forward
- 1. Water is flowing inside of a 3-std type K copper tube at a flow rate of 1.2 kg/s. The average temperature of the water is 50°C. Cold, dry air at a temperature of 5°C and atmospheric pressure flows outside of the tube in cross flow with a velocity of 85 m/s. Determine the UA product for this tube under clean conditions.arrow_forwardDetermine the following for the beam with unknown loading, using the Shear and Bending Diagrams provided in the figures on the right: a. The maximum shear stress experienced by the beam. b. The maximum flexural stress experienced by the beam (Indicate if this is tensile or compressive flexural stress) c. The loading diagram (Indicate the magnitudes of the loading/s. The loads are acting along the plane of symmetry of the section) 20 80 20 十十 SHEAR DIAGRAM x=577.3502692 mm 20 KN 1° 5/3 KN 2° C 2° D A B CROSS SECTION Dimensions are in mm LOADING DIAGRAM ? 120 40 40 A B C D 1000mm 2000mm 1000mm -55/3 KN MB' C D BENDING DIAGRAM MB A B Σ Mcarrow_forwardFind the maximum bending stress in ksi for this beam if it is made from a W16x50 steel shape. If the steel yields at 50 ksi, will the beam support the loads shown without permanently deforming? Confirm the max moment in the beam by drawing the shear and moment diagram. 18 kip-ft 2 kip/ft 9 ftarrow_forward
- Q2) by using SHI-Tomasi detector method under the constraints shown in fig. 1 below find the corner that is usful to use in video-steganography? 10.8 ...... V...... 0.7 286 720 ke Fig.1 Threshold graph. The plain test is :Hello Ahmed the key is: 3a 2x5 5b 7c 1J 55 44 2X3 [ ] 2x3arrow_forwardusing r languagearrow_forwardHints: Find the closed loop transfer function and then plot the step response for diFerentvalues of K in MATLAB. Show step response plot for different values of K. Auto Controls Show solutions and provide matlab code NO COPIED ANSWERS OR WILL REPORT!!!!arrow_forward
 MATLAB: An Introduction with ApplicationsEngineeringISBN:9781119256830Author:Amos GilatPublisher:John Wiley & Sons Inc
 Essentials Of Materials Science And EngineeringEngineeringISBN:9781337385497Author:WRIGHT, Wendelin J.Publisher:Cengage,
 Industrial Motor ControlEngineeringISBN:9781133691808Author:Stephen HermanPublisher:Cengage Learning
 Basics Of Engineering EconomyEngineeringISBN:9780073376356Author:Leland Blank, Anthony TarquinPublisher:MCGRAW-HILL HIGHER EDUCATION
 Structural Steel Design (6th Edition)EngineeringISBN:9780134589657Author:Jack C. McCormac, Stephen F. CsernakPublisher:PEARSON
 Fundamentals of Materials Science and Engineering...EngineeringISBN:9781119175483Author:William D. Callister Jr., David G. RethwischPublisher:WILEY